
Hammock Matrix
A credit officer asks how many contracts sit behind 1 crossing of clearing house, jurisdiction, and rating. Parallel coordinates draw 5 contracts and 5,000 as the same line, and Sankey ribbons tangle past 4 axes. I designed a 6-tier ribbon board with a tracer and an exact cohort query, so concentration reads at a glance and every band can be counted.
- Data visualization
- Hammock plots
- Counterparty risk
- Capital markets
- Information design
- Data quality
Lines that hide volume
01 · ProblemA clearing portfolio lives in 6 taxonomies at once: asset class, clearing house, jurisdiction, credit tier, collateral, and maturity. Standard parallel coordinates draw every record in a discrete category through the same point, so a crossing that carries 5 contracts looks identical to one that carries 5,000.
Sankey diagrams fix the volume but fail the width: past 4 or 5 tiers the ribbons cross into an unreadable tangle, and classification concentration is hard to inspect before a rating-change review.
The question this case answers is narrow: how to keep the parallel axis reading analysts know while making band width mean contracts, on every leg, at every angle.
- Role
- Product designer. I designed the categorical concentration board, volume encoding, exact cohort inspection, and missing-classification workflow.
- Workflow
- Clearing-book review: inspect concentration across classifications, query the actual cohort, and keep missing values in the count.
- Data coverage
- 20,000 clearing records across 6 tiers and 30 categories, with 1 concentrated category path and 1 unclassified pocket.
- Verification
- Counts reconcile across marginals, adjacent flows, and joint cohorts. Geometry checks expose the correction cap; the protocol tests concentration reading.
- Related products
- Modern Treasury connects ledger inspection and reconciliation. MSCI CreditManager covers portfolio credit exposure and rating scenarios. This board makes classification and cohort counts inspectable before a risk model is applied.
Inspiration. Matthias Schonlau’s hammock plots, presented at Data Visualization New York in May 2025: parallel axes kept, zero thickness lines replaced with volume proportional ribbons.
Keep the axes analysts know, replace lines with ribbons, and treat unclassified records as a visible risk category that stays reviewable.
Read the width, check the count
02 · MechanismHammock plots keep the familiar parallel axis structure and replace zero thickness lines with solid ribbons between category intervals. The book contains 125 adjacent flows across Asset Class, CCP, Jurisdiction, Credit Tier, Collateral, and Maturity.
The trap is the line width illusion. The eye judges a band across its thickness, at right angles to the band, not along the axis. A steep band with the same vertical span as a flat one is physically thinner across, so it reads lighter than its contracts. The board widens every span by 1/cos(theta), capped at 1.5, so thickness across the band matches its contracts up to a 48 degree slope. Steeper bands still read slightly light, and the tracer and table carry the exact count.
Heavy bands are then pulled toward the horizontal by barycentric reordering: each category sorts by the weighted center of its flows, which cuts crossings without moving any number. The toggle in the board runs that pass live.
Same contracts, same thickness across the band. Without the correction, slope quietly removes volume from the steepest legs.
Adjacent legs do not define a cohort
Read the decision flow
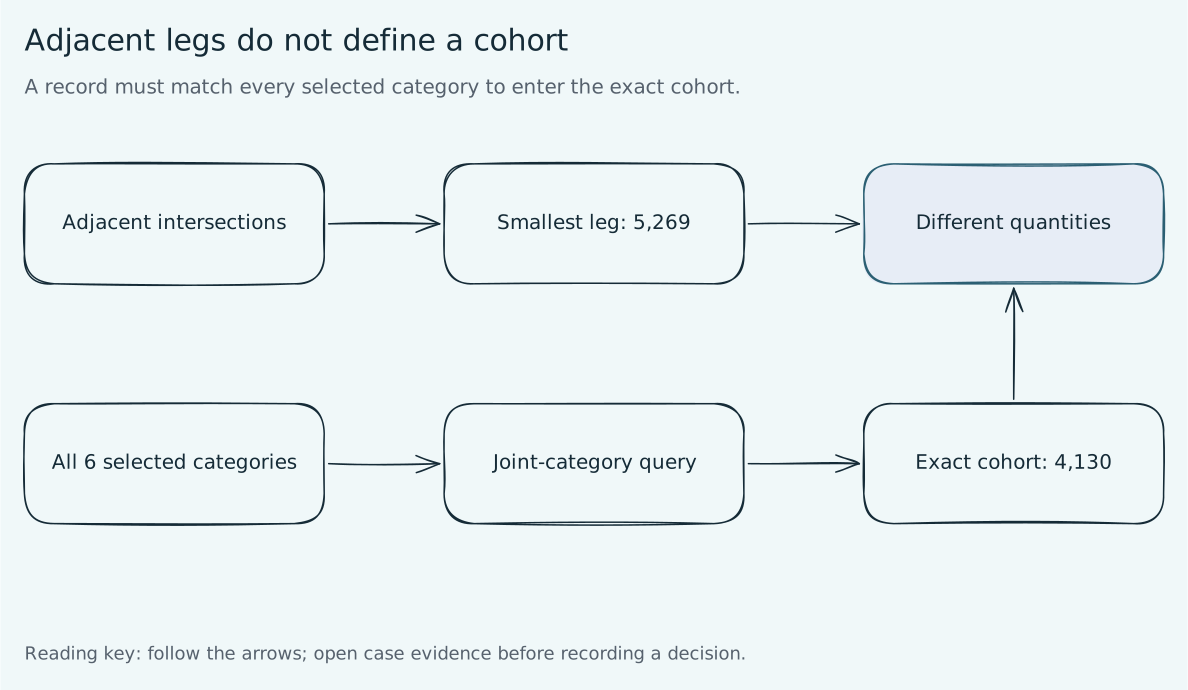
- Adjacent ribbons are 2-category intersections
- A chain minimum is an upper bound on a full intersection
- Select categories across axes
- Query joint-category counts
- Compare 5,269 minimum adjacent contracts with 4,130 exact cohort contracts
The board
03 · The prototype1 working tool, built from 1 data file: 6 axes with category blocks sized by marginals, a ribbon field between each pair, and a tracer panel. Selecting a category brightens its bands, dims the rest, and lists the 3 largest upstream and downstream legs with counts. A first-run button traces the hub of the heaviest path.
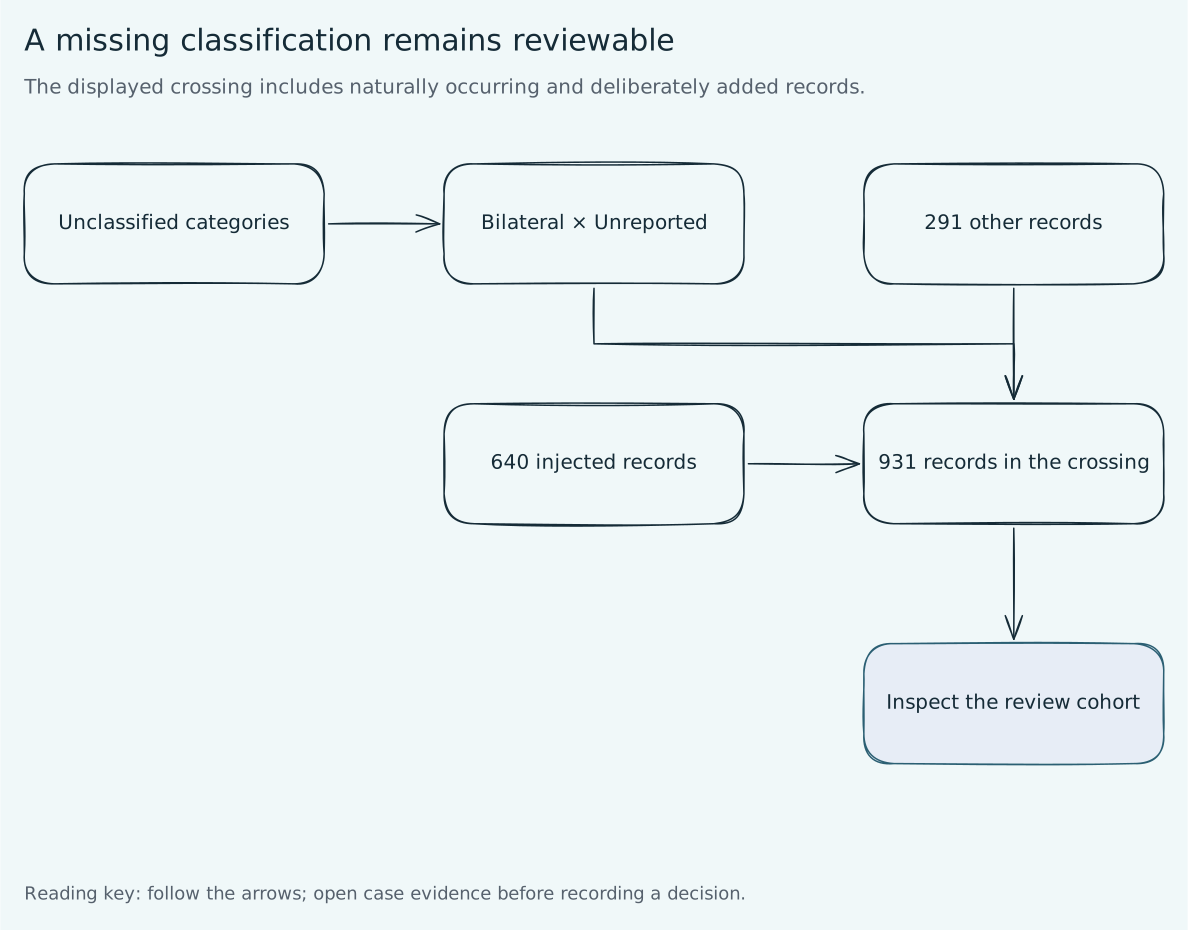
The concentrated path (Rates through CCP-Central, US, BBB, Gov bonds, 1-5Y) carries a leg minimum of 5,269 contracts. The unclassified pocket (uncleared bilateral trades with no reported jurisdiction) holds 931 contracts and is drawn hatched, never hidden.
The exact cohort inspector links 6 category filters to the joint record counts. The highlighted adjacent legs have a 5,269-contract minimum; selecting the full path counts 4,130 shared contracts. The default threshold hides 4 small bands from the field while retaining every flow in the table.
Click any category to trace it. Align heavy flows runs the crossing pass. Every band has the full flow table behind it.
Authored inventory, counted from the data file
These are not user outcomes. They are counts the generator writes and the board reads, so each one can be checked in the table inside the tool.
Tracing BBB classifications
04 · A worked traceThe question the board is built for: BBB is about to be cut, so what sits behind it and what does it touch next? On a line chart every BBB record passes through the same point, and the answer is a query. On the board it is 1 click.
BBB holds 8,444 contracts, 42.2% of the book. 5,712 of them arrive from US jurisdiction, against 1,008 from the EU and 872 from the UK. Downstream, 5,269 are collateralised with government bonds, 1,389 with cash, and 755 with corporate bonds. The BBB to Gov bonds leg is the narrowest link of the concentrated path, which is why the path’s minimum is 5,269.
The tracer answers with a ranked list, and the ribbons show where each leg goes next.
A missing classification remains reviewable
Read the decision flow
- Keep unclassified values as categories
- Bilateral and Unreported define an exact crossing
- The crossing contains 931 records
- Open and reconcile the review cohort
4 layers, 1 reading
05 · Layers-
Hammock canvas
6 tiers rendered as parallel axes with category blocks sized by marginals. Bands connect adjacent tiers only, which keeps every width readable and every crossing local.
Covers: Asset Class, CCP, Jurisdiction, Credit Tier, Collateral, Maturity.
-
Slope-corrected geometry
Slope compensation improves equal-count comparisons. Exact counts remain available when the 1.5 widening cap leaves a steep ribbon visibly thinner.
Rule: widen by 1/cos(theta), capped at 1.5. Bands steeper than 48 degrees keep a small, labelled shortfall.
-
Snapshot plots with missingness
Marginal counts sit under every category, and unclassified values (Unassigned, Unreported, Unrated, None, Unspecified) render hatched, 5 categories holding between 1,220 and 2,456 contracts each. The Bilateral plus Unreported pocket is an explicit operational risk, not a filter default.
Effect: all 931 contracts in the Bilateral × Unreported crossing remain countable and available for review.
-
Concentration flow tracer
Selecting a node dims unrelated bands and lists the 3 largest upstream and downstream legs with contract counts. The concentrated path can be followed tier by tier without losing its count.
Effect: a downgrade question ends at a ranked list, not a tangled field.
Who reads the board
06 · AudienceConcentration is a question several desks ask of the same book for different reasons.
- Credit officers
- Need to see what a BBB downgrade touches, and through which clearing houses and jurisdictions it travels.
- Chief risk officer
- Needs the heaviest path through the book in 1 view, and confidence that the unclassified records are counted.
- Clearing and collateral operations
- Need the collateral mix behind each rating and maturity bucket, and the bilateral trades with no reported jurisdiction.
- Data governance
- Need to see where classification is missing, and how many contracts each gap holds.
- Model risk and audit
- Need every band backed by a row they can check, which the flow table provides.
Where this transfers
07 · Same shape, other fieldsAny record described by a chain of categories, where volume and the missing values both matter, reads better as ribbons than as lines.
- Payments and AML
- Channel, corridor, merchant category, and alert outcome, with unscreened transactions kept visible.
- Insurance
- Line of business, region, reinsurer, and claim status, where concentration in 1 reinsurer is the risk.
- Supply chain
- Supplier tier, country, component, and plant, where a single-source path is the exposure.
- AI evaluation
- Prompt category, model, failure type, and reviewer verdict, with unlabelled outputs counted instead of dropped.
3 decisions
08 · Trade-offs- Ribbons over lines
- Volume is visible without a second encoding, which is the whole point. The price is overplotting where many small flows share a leg, handled by the minimum flow control that hides bands but never removes their rows from the table.
- Show missingness, never drop it
- Hatched blocks add visual noise to 5 of 6 axes. Missing classifications remain in the denominator. The exact Bilateral × Unreported query identifies 931 contracts for review, without assigning a loss estimate.
- Dim, not hide, on trace
- Unrelated bands fall to background instead of disappearing, so the reader keeps the full book in peripheral view. The price is a busier selection state than a filtered list.
The 1.5 cap on the slope correction means bands steeper than 48 degrees still read slightly light. If a study shows readers underestimating diagonal bands, those legs get a numeric label rather than more width, because more width would start to overlap their neighbours.
What the model establishes
The adjacent path minimum is 5,269 contracts; the exact 6-category cohort is 4,130. The Bilateral/Unreported crossing is 931 contracts. Pairwise ribbons cannot prove an end-to-end intersection. The exact query uses joint-category counts. Credit and maturity preserve ordinal order. Geometry compensation is capped at 1.5; steep bands may retain distortion. This view counts classifications; it does not model default transmission, notional exposure, netting or financial loss.
What I would measure
09 · The study this needsThe board makes an argument. It does not yet have evidence from users. This is the study I would run before calling ribbons better, with the pass line set before any session.
- Participants
- 5 to 8 people who read clearing or credit exposure views: risk managers, credit officers, and operations analysts.
- Task
- Inspect BBB and identify its 3 largest adjacent flows. Then count the exact 6-category cohort and the Bilateral × Unreported crossing. Each person answers on the board and on a parallel coordinates plus table baseline, with order counterbalanced.
- Measures
- Time to correct counts, pairwise totals mistaken for a full cohort, and stated confidence on a 5-point scale.
- Pass line
- The board earns its place only if readers find the correct flows and cohort counts faster with no additional counting errors. If steep bands mislead, the correction cap is the first thing revised.
How it is built
10 · Stack and craft- 1 single-file HTML board with vanilla JavaScript and hand-built SVG. No framework, no chart library, no network calls. It runs from disk as well as from a server.
- 1 seeded generator writes the data file, and a small build step injects it, so the ribbons, the tracer, and the table can never disagree about a count. Reruns are byte-identical.
- Deep links name any node and the axis order, and update without polluting drawer history. A details table lists all 125 flows for readers and for checks.
- Keyboard-operable category lists with arrow movement, announced selection, a text title on every band, and the flow table as a fallback. Labels on the plot scale so they never render under 12px, and move to the list on a narrow screen. Nothing animates. Built to a WCAG 2.1 AA target, not audited.
- Diagram sources: editable Excalidraw files with SVG and PNG exports.