Know Who Knows
An enterprise talent mapping interface that turns organizational complexity into a navigable visual atlas: from broad query to shortlisted team, through three coordinated views of the same workforce.
The design challenge was not to build a better search. It was to prevent candidate misreads by making the topology of expertise visible, so a manager can see not just who has the skills, but who is the connector.
The other showcases in this portfolio (Uncertainty as Signal, Volatility Surface, North Bridge, HR as DJ, What Gets Measured) all share the same underlying design problem: when a decision-maker misreads dense information, the consequence lands in capital, operating risk, or an irreversible call. The interface is the layer between the complexity and the decision.
This showcase is the earliest version of that problem in my practice. The original work was built for a platform that mapped organizational entities: companies, individuals, their attributes and relationships. Analysts could navigate through layers of data to find the specific connections that mattered for a given inquiry. The tool needed to handle hundreds of entities, dozens of relationship types, and the kind of investigative narrowing that starts with a document and ends with a name.
Finding the right expert is not a search problem. It is a graph navigation problem. The person you need is rarely the person with the most skills. It is the person who knows the most people with the right skills.
Three Views, Three Questions
The design insight that drove the interaction model was this: the same person looks completely different depending on which view you are using to examine them. In a table, they are a row of attributes. In a treemap, they are a block of proportional weight inside a cluster. In a network graph, they are a node with a specific position in a topology: central, peripheral, or bridging. Each view answers a different question, and the right view depends on what kind of decision you are trying to make.
A manager assembling a team for a critical AI initiative is not trying to find the person with the highest skill score. They are trying to find the person who can pull the team together: who has the relationships across departments, who is trusted by the domain experts they need to recruit, who has worked with enough of the relevant people that the team will actually function once formed. That is a topology question, and it cannot be answered by sorting a table.
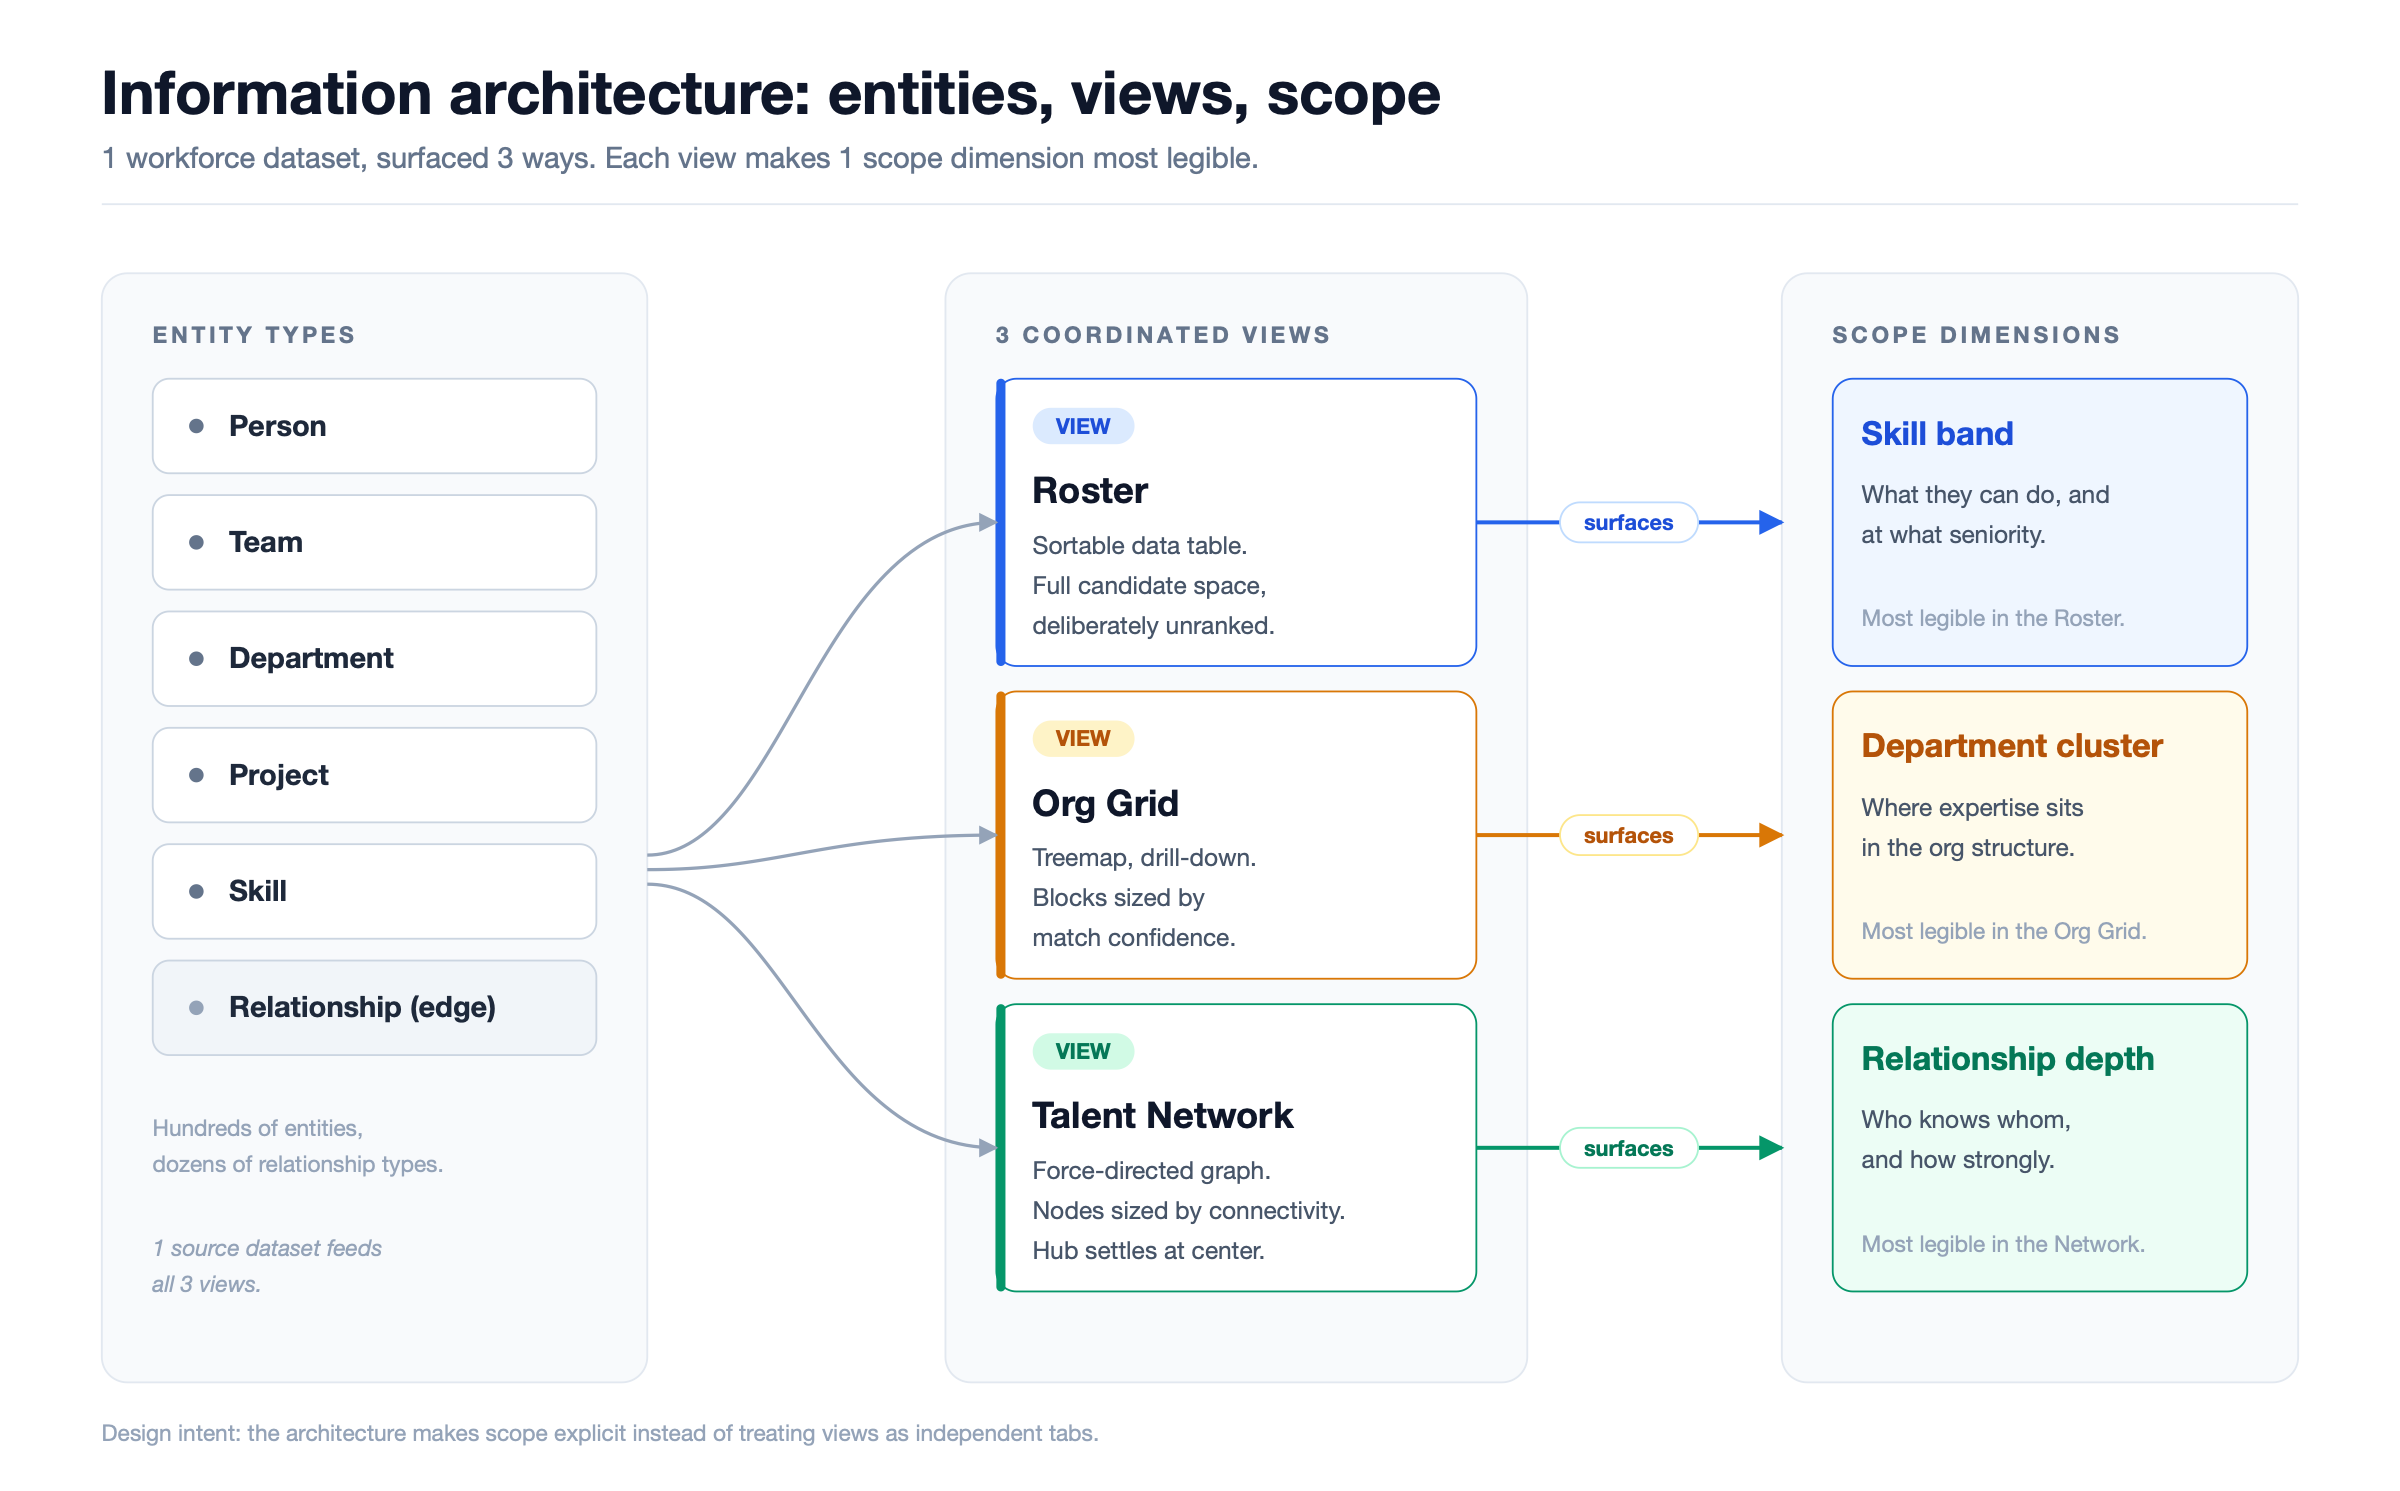
The three views were designed as a progressive narrowing sequence, not as independent navigation options. You start in the Roster because you do not yet know what you are looking for: you have a project brief and a rough sense of the skills it requires. The Roster shows you the full candidate space, sortable and filterable, but deliberately neutral about relative importance. Nothing is ranked because ranking at this stage would be premature.
You move to the Org Grid when you notice a pattern in the Roster that prompts a structural question: why are there so many relevant candidates in a department that has nothing to do with the initiative? The Grid is a treemap that shows you where those candidates sit in the organizational structure. Blocks are sized by match confidence. Drilling down reveals clusters of co-located expertise: teams that have already built the skill set you need, teams you may not have known existed.
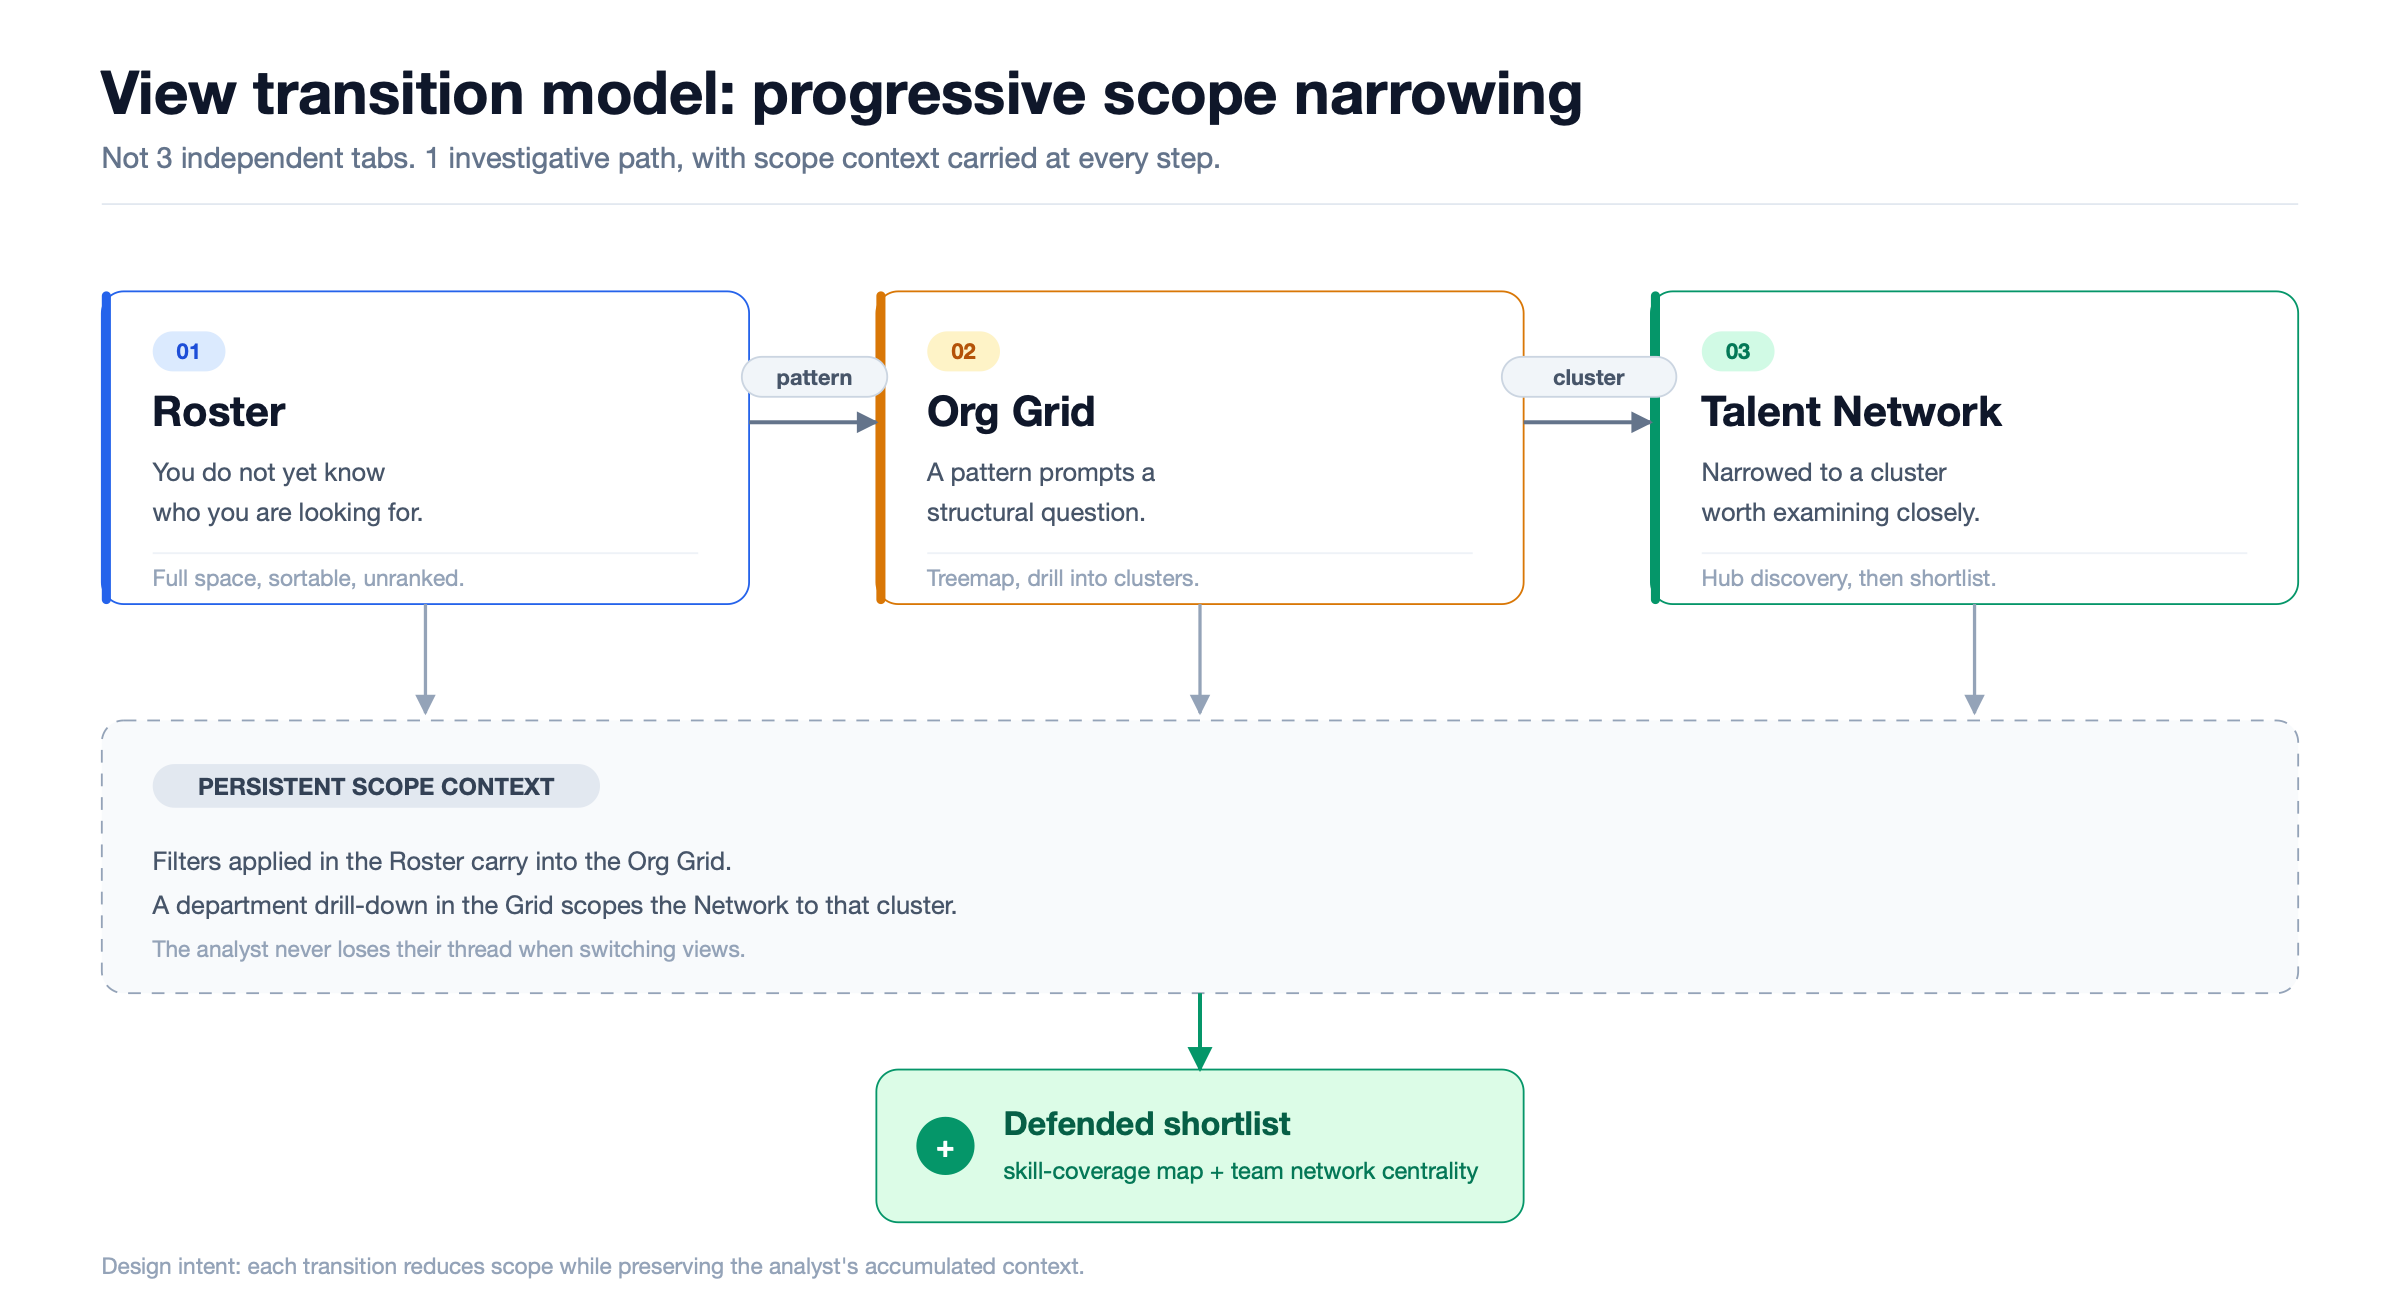
You move to the Talent Network when the Org Grid has narrowed the candidate space to a cluster worth examining closely. The network shows the relationships between people: past projects, shared managers, co-authorship, collaboration history. Nodes are sized by connectivity. The hub node is the person you are actually looking for: not necessarily the one with the most skills, but the one who knows the most people in the cluster.
The hub discovery is the core interaction. In a force-directed graph, hub nodes naturally migrate toward the center as the physics simulation settles. The visual affordance is immediate and physical: the most connected person is at the center of the group. You do not need to run a centrality algorithm in your head. The topology makes it visible.
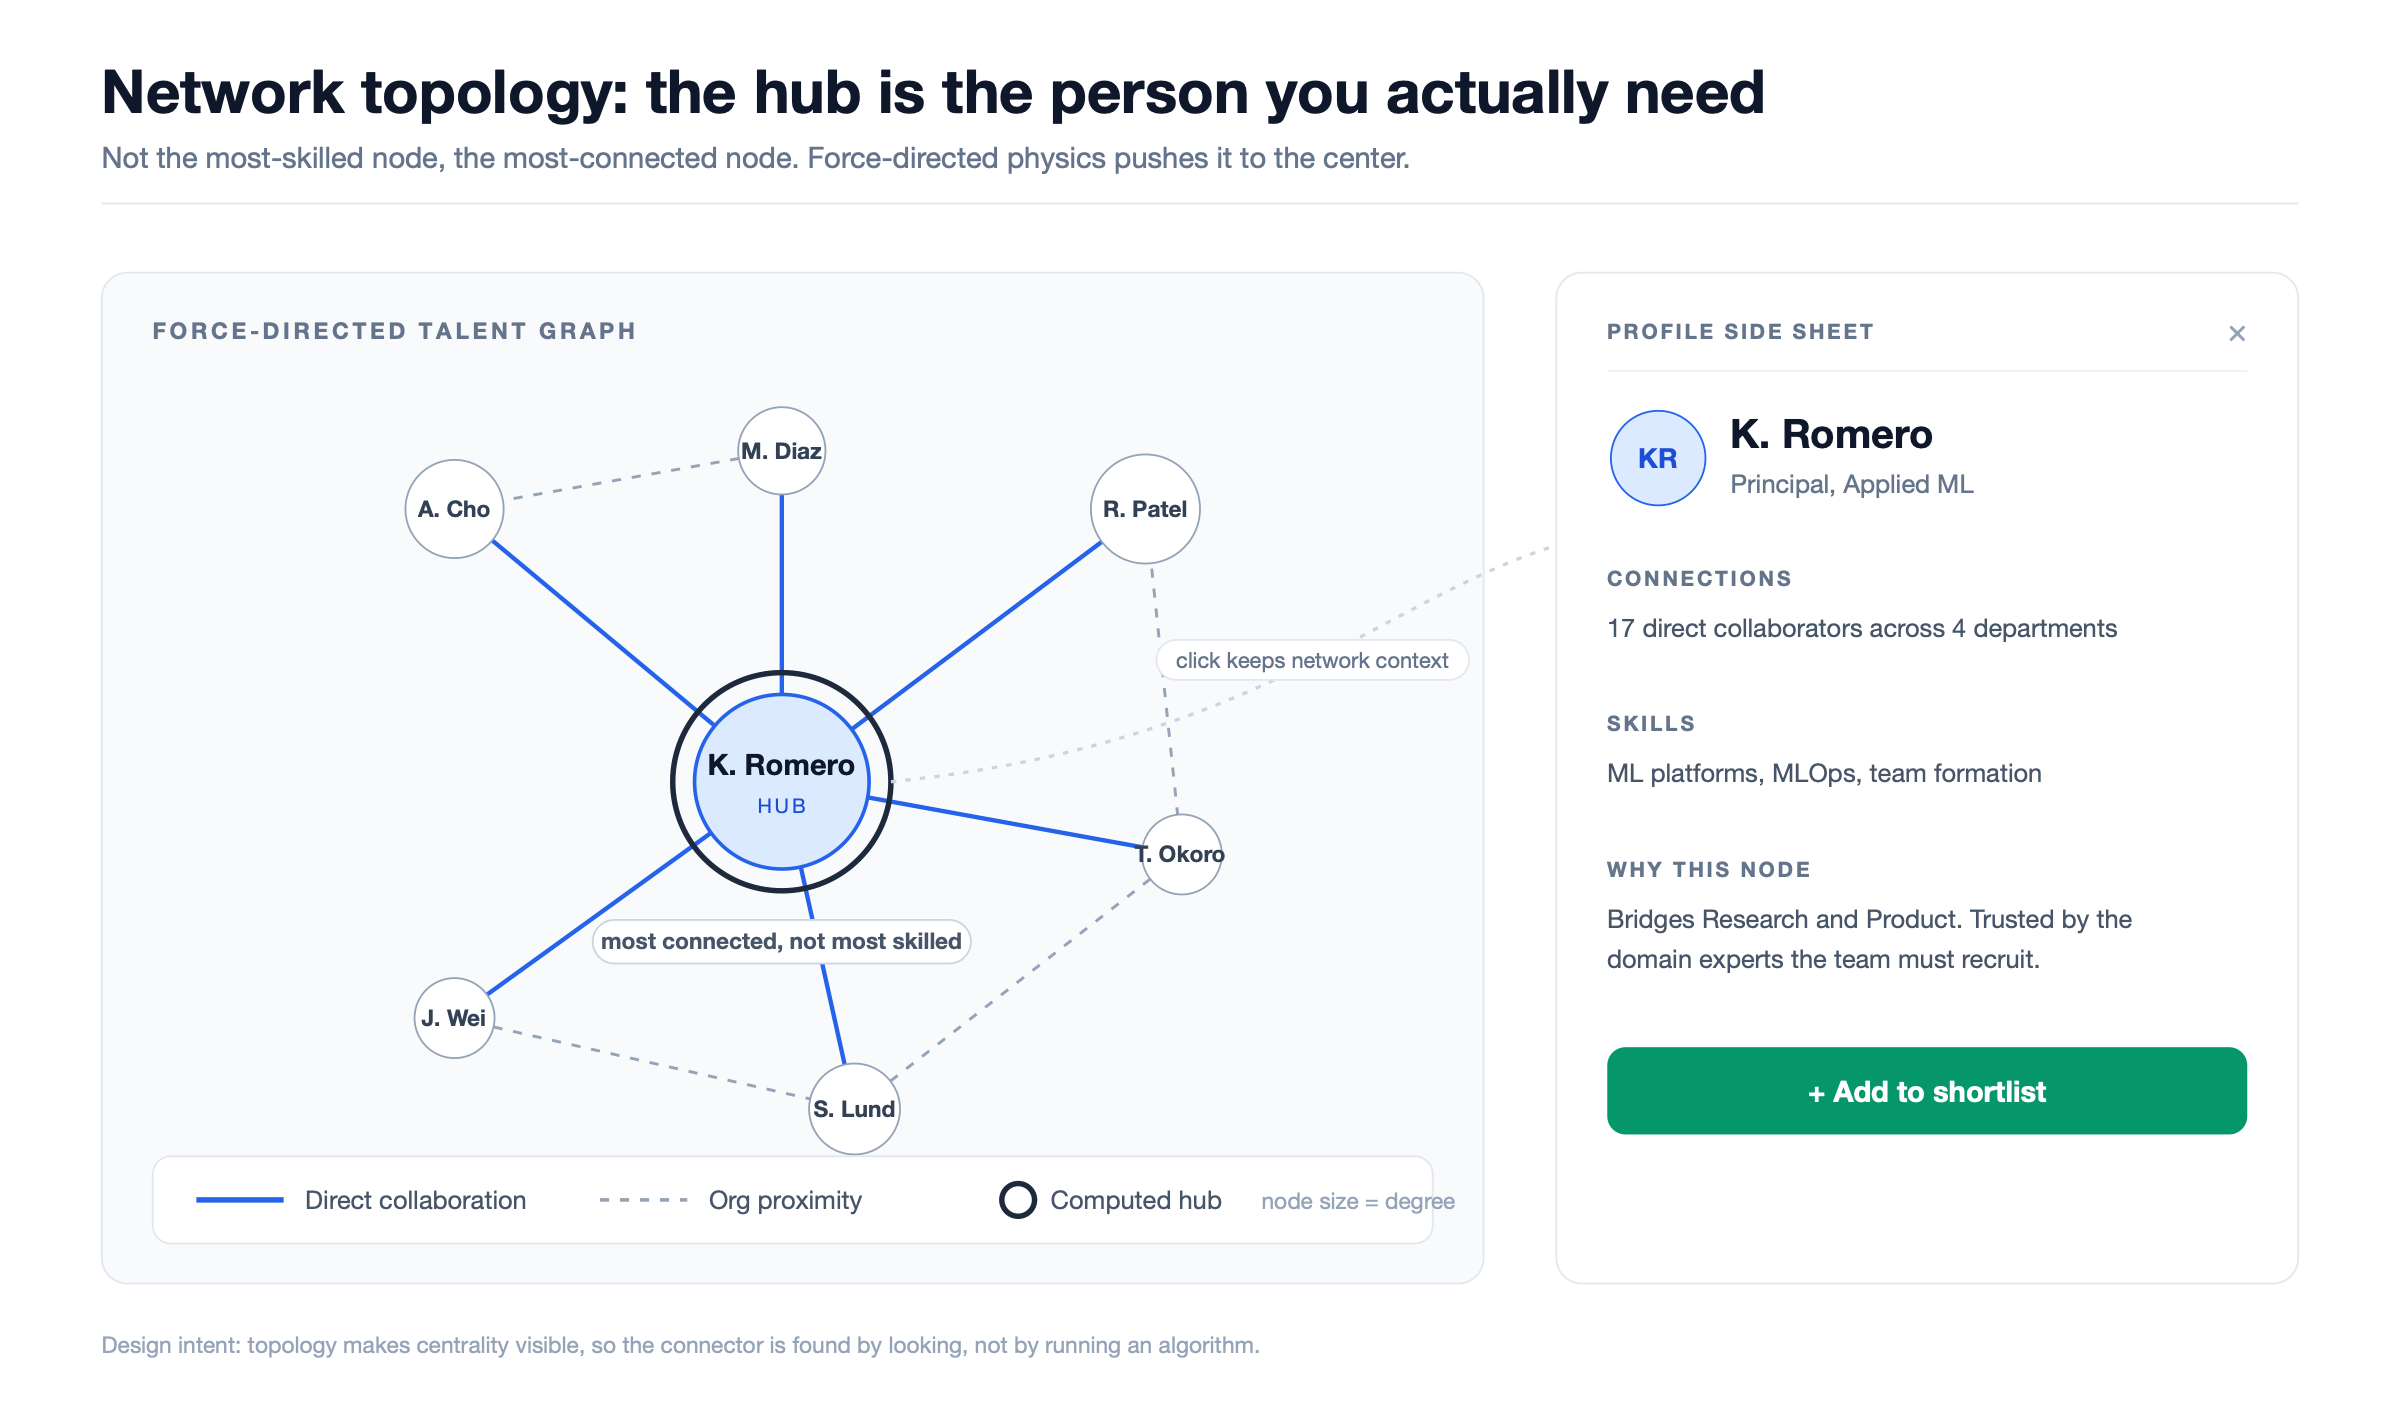
The shortlist mechanism closes the loop. Dragging a person from the network to the shortlist, or clicking the add button on their profile sheet, adds them to a persistent shortlist visible as a badge on the floating action button. The shortlist panel shows not just who is on it, but the coverage map: which skill clusters have been addressed, which remain open, and what the team’s network centrality looks like as a whole. A team of individually excellent people who have never worked together is a different risk profile than a team of slightly less skilled people with dense shared history.
Guided tour available · Simulated organizational data · Portfolio demonstration
The 2026 reconstruction reframes the original entity-navigation model as an HR and talent application. It preserves the three-view architecture and progressive scope narrowing, then adds a guided path from project brief to discovered hub to defended shortlist.
The core logic stayed intact: view transitions keep context, hub detection favors relationship topology over raw skill rank, and each view answers a different decision question. What changed is the domain framing, visual system (Material Design 3, high-contrast dark mode), and onboarding layer needed for portfolio readers.
Technical Details
- Three coordinated views: Roster (sortable data table), Org Grid (treemap with drill-down), Talent Network (force-directed graph)
- Persistent scope context across view transitions: filters carry forward, drill-down scopes the network
- Hub node detection: centrality weighted by relationship type and collaboration depth
- Shortlist panel with skill-coverage map and team network-centrality summary
- Embedded guided tour walking through the full tiger-team assembly critical path
- Material Design 3 system, dark mode, high-contrast pearl/black palette
- Single-file HTML prototype with no build tools, no framework dependencies
- Original build: mixed-fidelity HTML5 prototype with Protovis/D3.js predecessor, for a major financial and legal intelligence platform
All organizational data is simulated. No confidential client information is disclosed. The original work was built for an internal platform at a major financial and legal intelligence organization and has been obfuscated and re-framed for this portfolio presentation. The three diagrams (information architecture, view transition, network topology) are reconstructions of the original design logic; the interaction model and design decisions are authentic to the original engagement.
What This Demonstrates
Finding the right person in a large organization is not a retrieval problem. It is a representation problem. When organizational structure is opaque, managers default to the people they already know, not because they are the best fit, but because the topology of expertise is invisible. When the topology becomes visible, the decision improves.
This showcase demonstrates how the same dataset can be encoded across three coordinated views (table, treemap, network), each surfacing a different structural dimension, each supporting a different decision moment, and each preserving enough shared context that the analyst never loses their thread. The design principle is not interface variety. It is that the right view at the right moment is itself a form of uncertainty reduction.
Decision Logic Before Build
A cross-platform clinical mobile prototype (iOS and Android) that verifies decision logic, accessibility structure, and workflow coverage before native build begins.
View case study →
Incline Trust
An AI exception-review workspace for corporate spend that keeps model uncertainty visible and binds each verdict to an immutable audit artifact.
View case study →