What Moved First / design diagrams
Decision flows, supporting boards and model evidence. All shapes, labels and connected arrows are editable in the native Excalidraw files. Open a downloaded file in Excalidraw to revise it. SVG and PNG exports are ready to share.
Evidence before a finding
A significant association is a starting point for investigation.
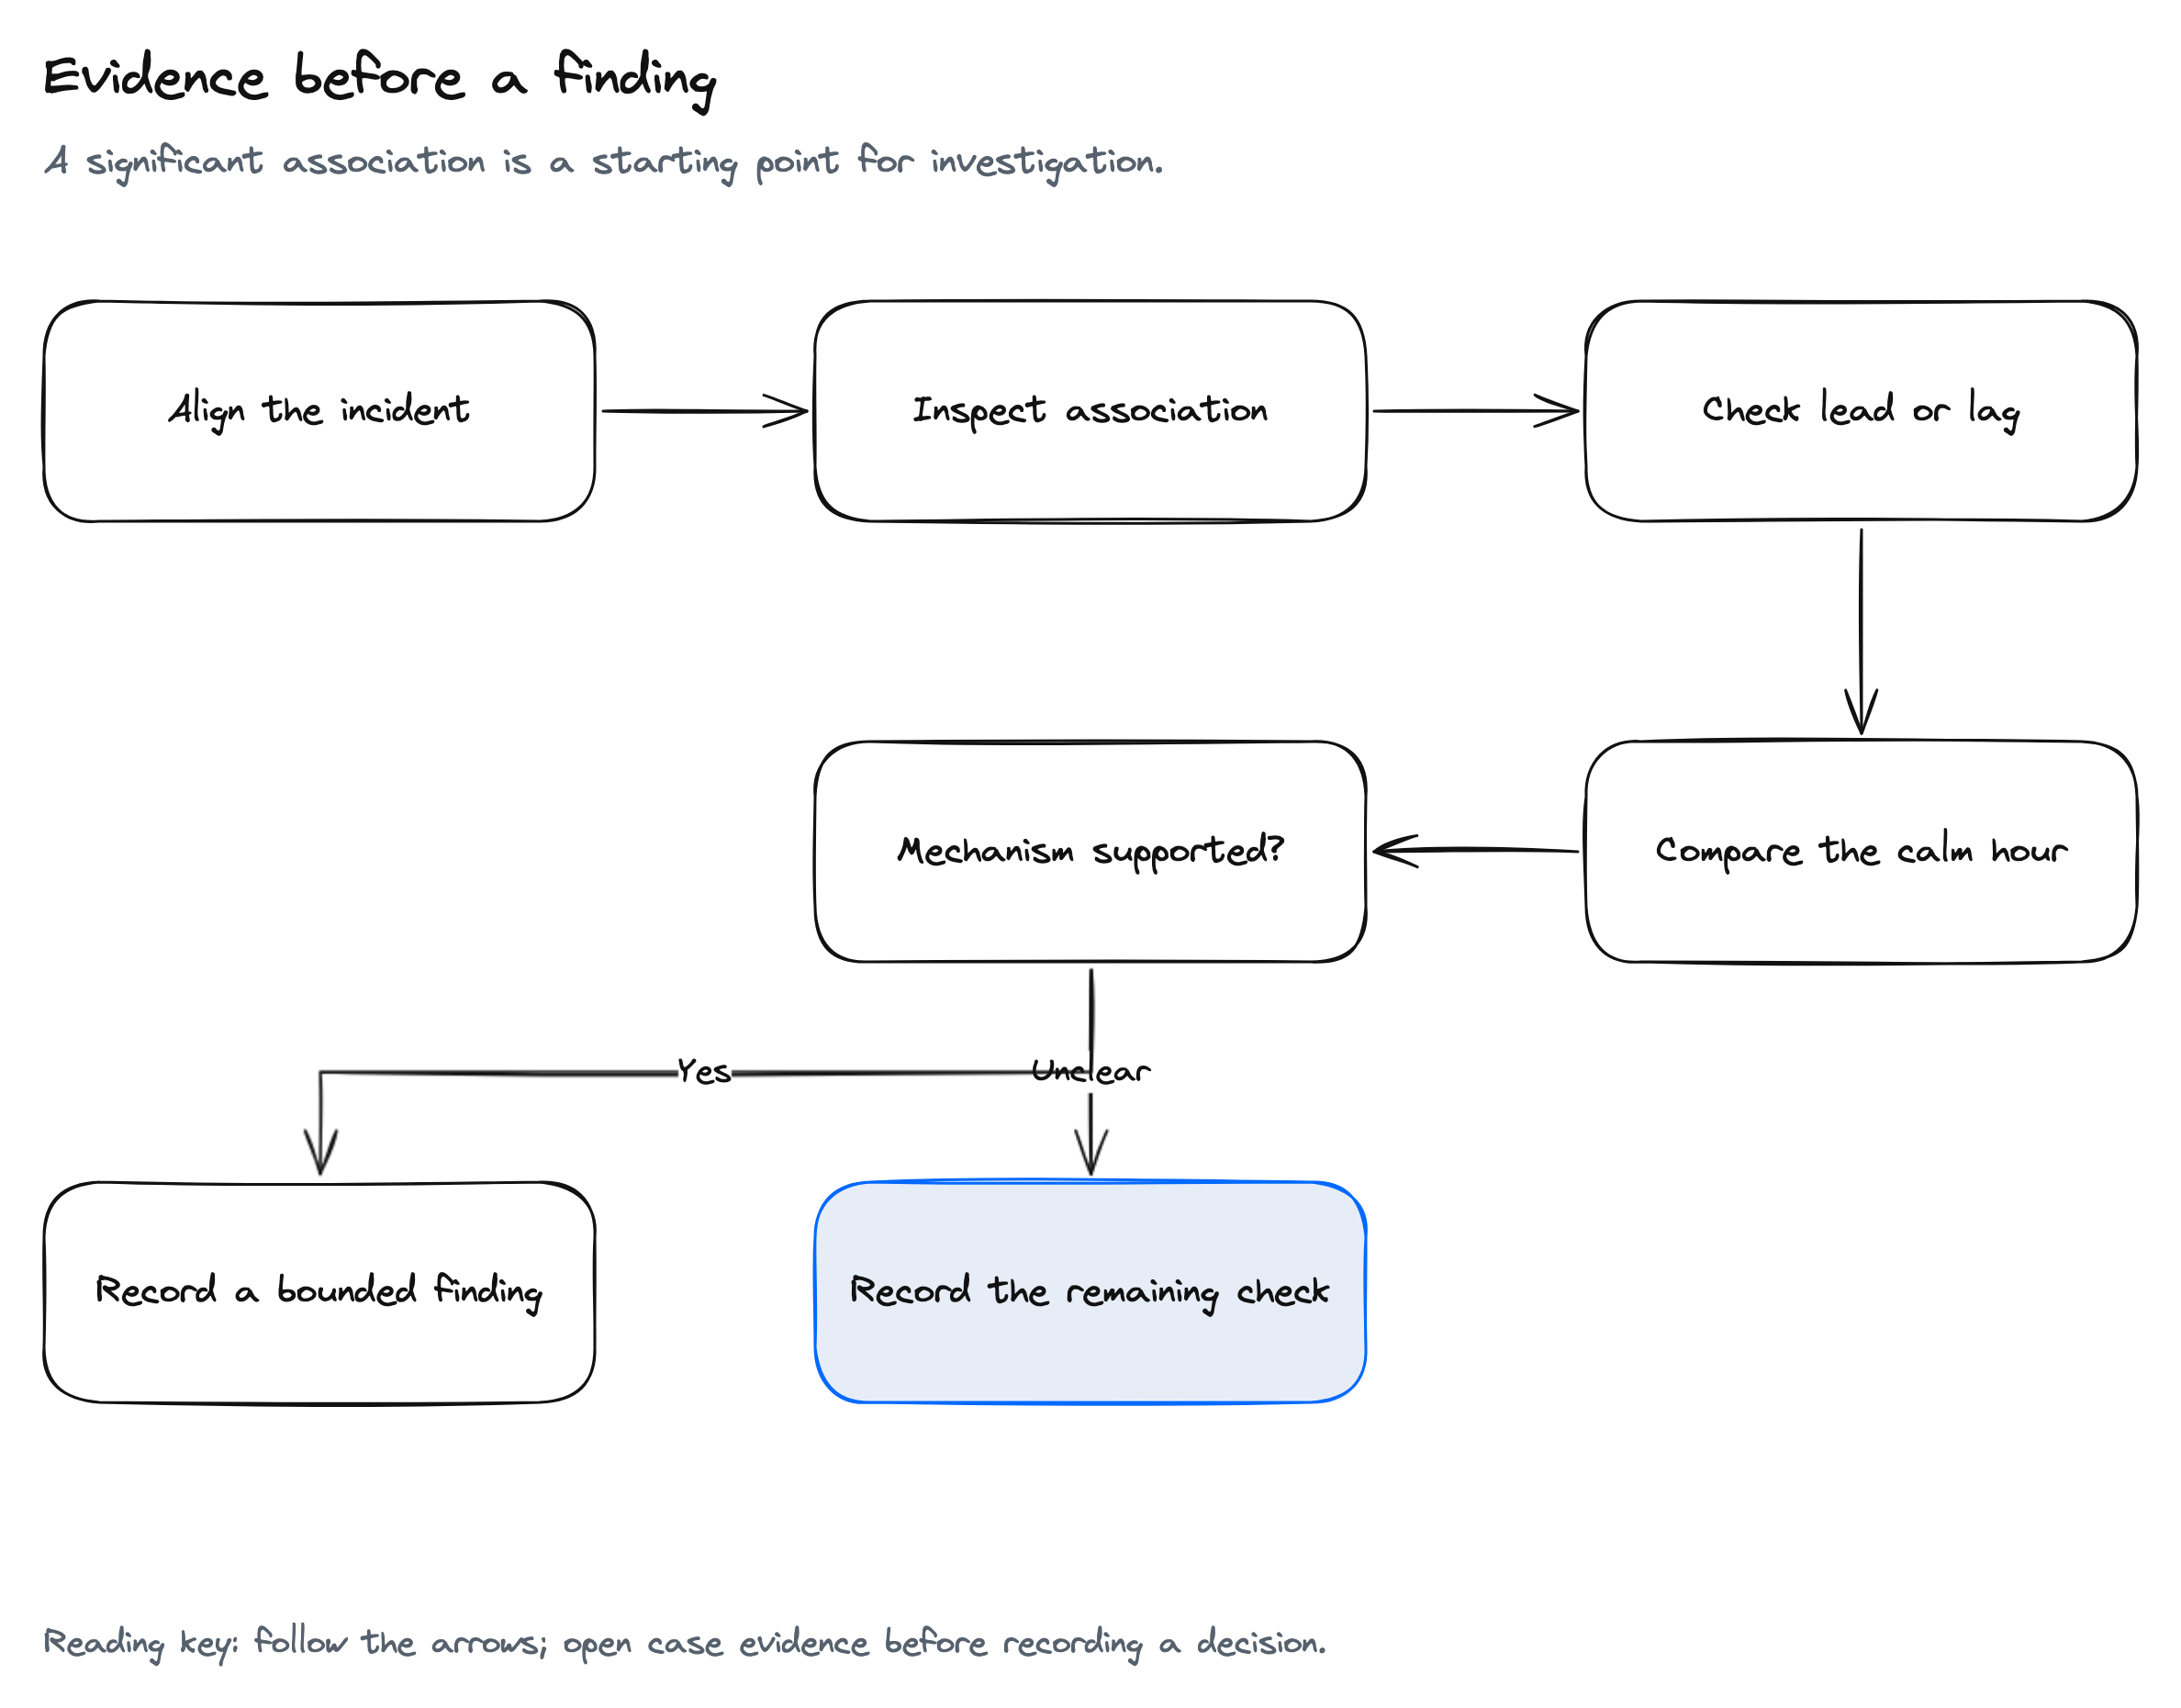
Read the diagram as text
- Align the incident and candidate signals
- Inspect the association scan
- Check whether the candidate leads or follows
- Compare the calm hour
- Name the mechanism still needing confirmation
Find the stalled handoff
Time-aligned evidence points to a process step, not just a suspicious signal.
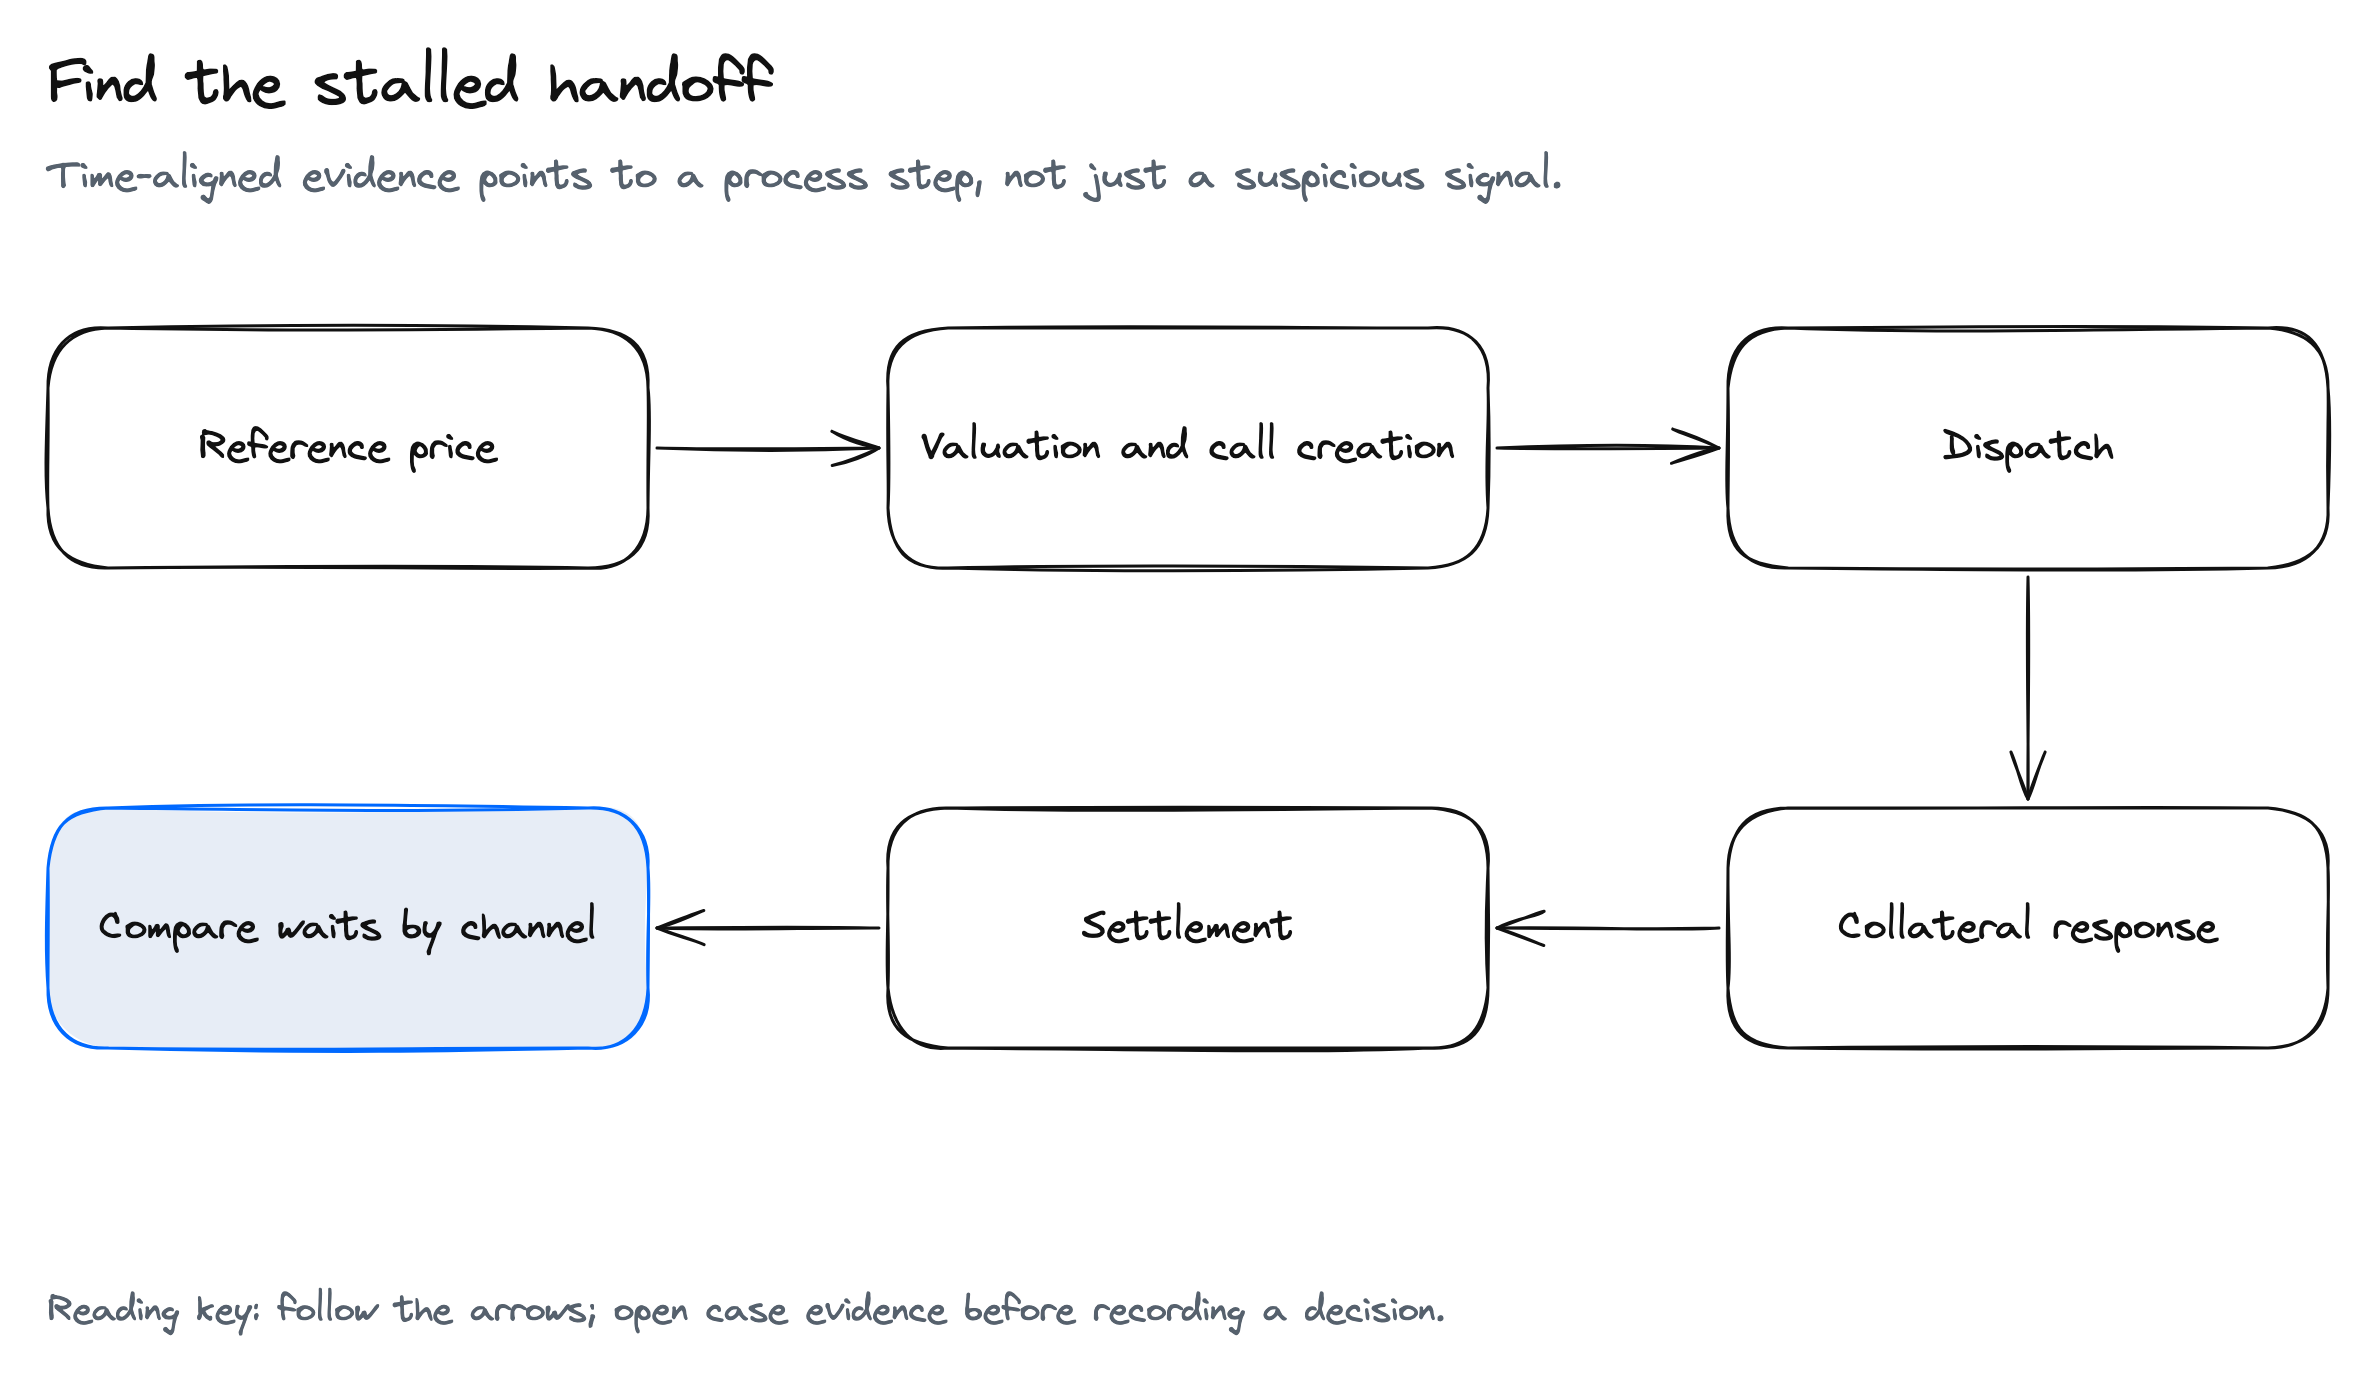
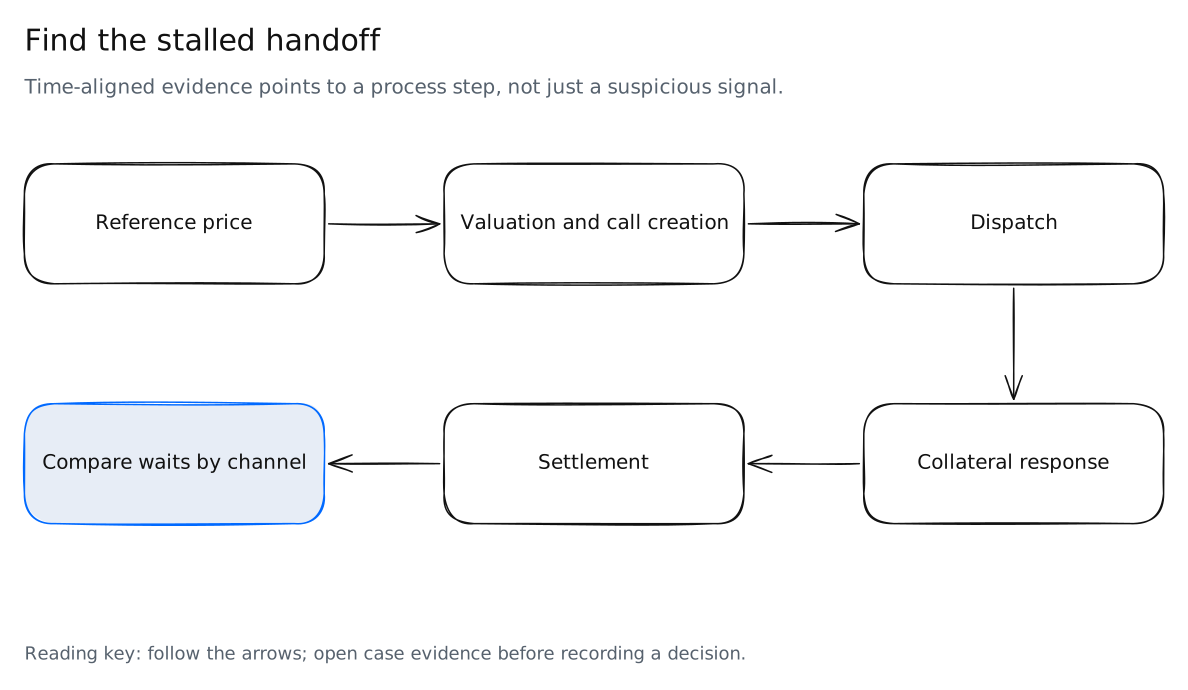
Read the diagram as text
- Reference price refreshes
- Valuation creates a margin call
- Dispatch sends the call
- Collateral response arrives
- Settlement resolves the response
- Inspect duration at the stalled transition
From association to a process explanation
A schematic investigation sequence; no elapsed times are implied
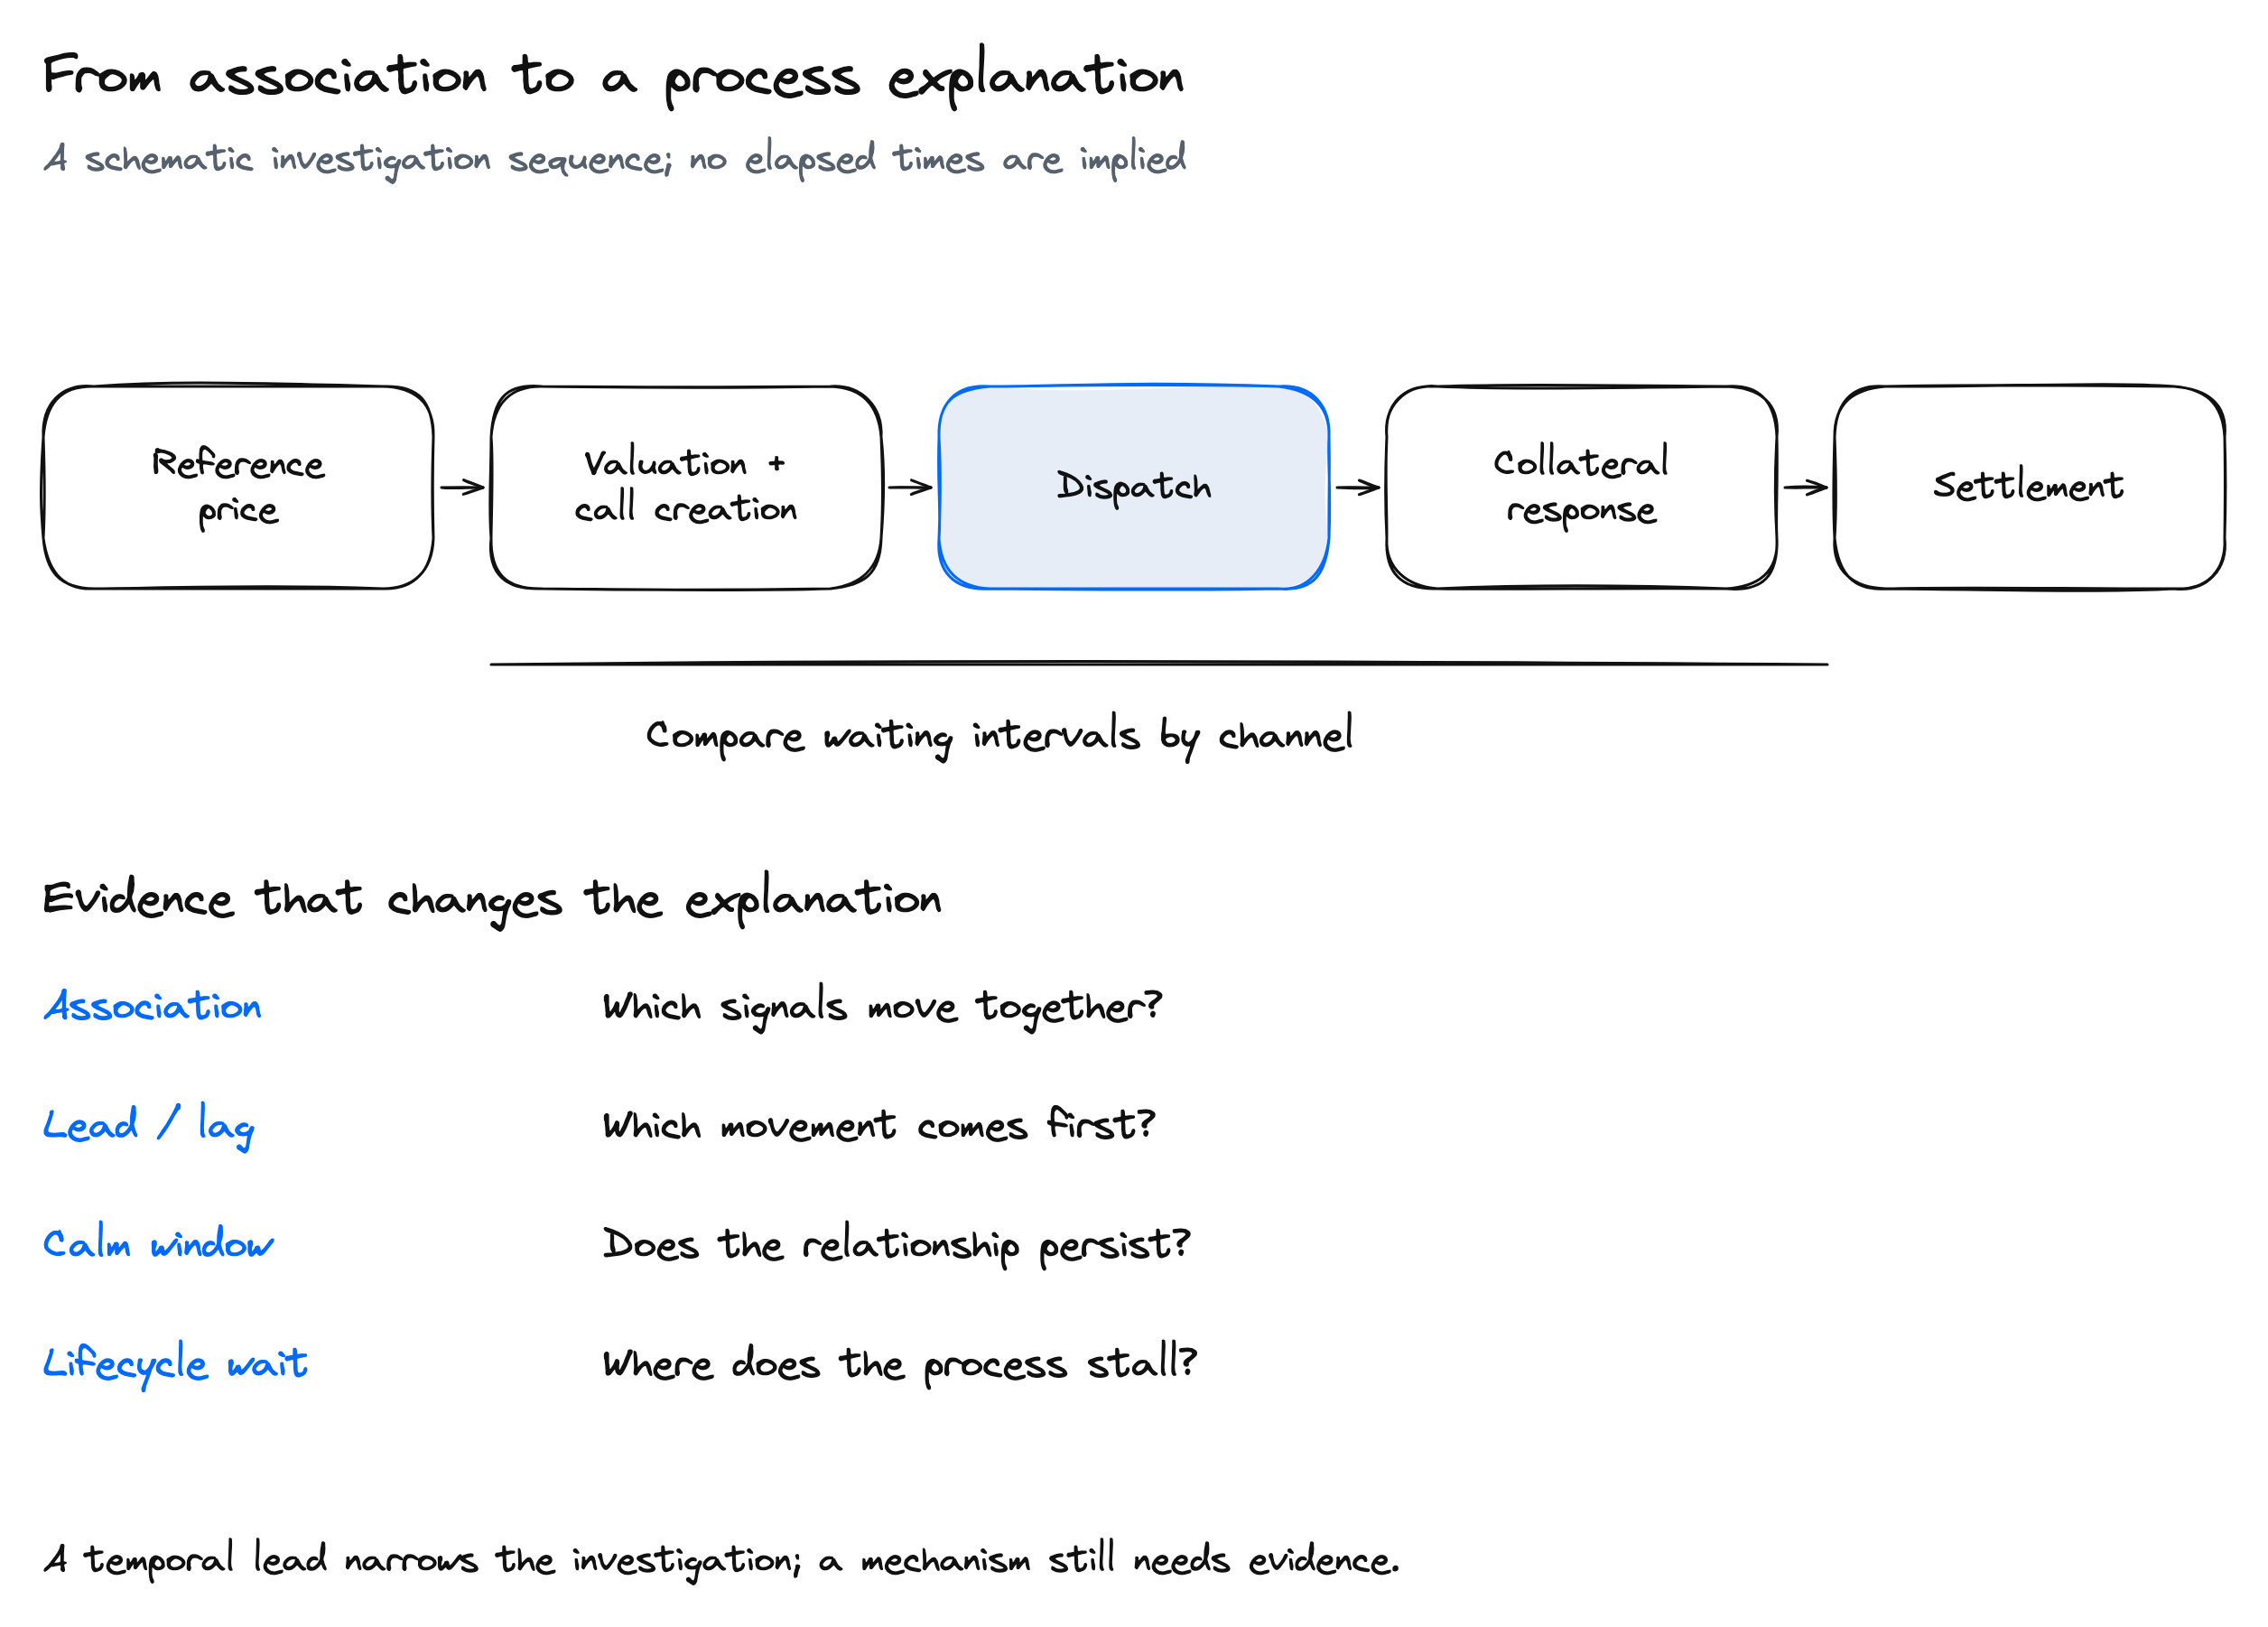
Read the diagram as text
- Reference
price - Valuation +
call creation - Collateral
response - Dispatch
- Settlement
- Compare waiting intervals by channel
- Evidence that changes the explanation
- Association
- Which signals move together?
- Lead / lag
- Which movement comes first?
- Calm window
- Does the relationship persist?
- Lifecycle wait
- Where does the process stall?
- A temporal lead narrows the investigation; a mechanism still needs evidence.
When / which / where / shared evidence
Scientific chart translations preserve their original inspiration references
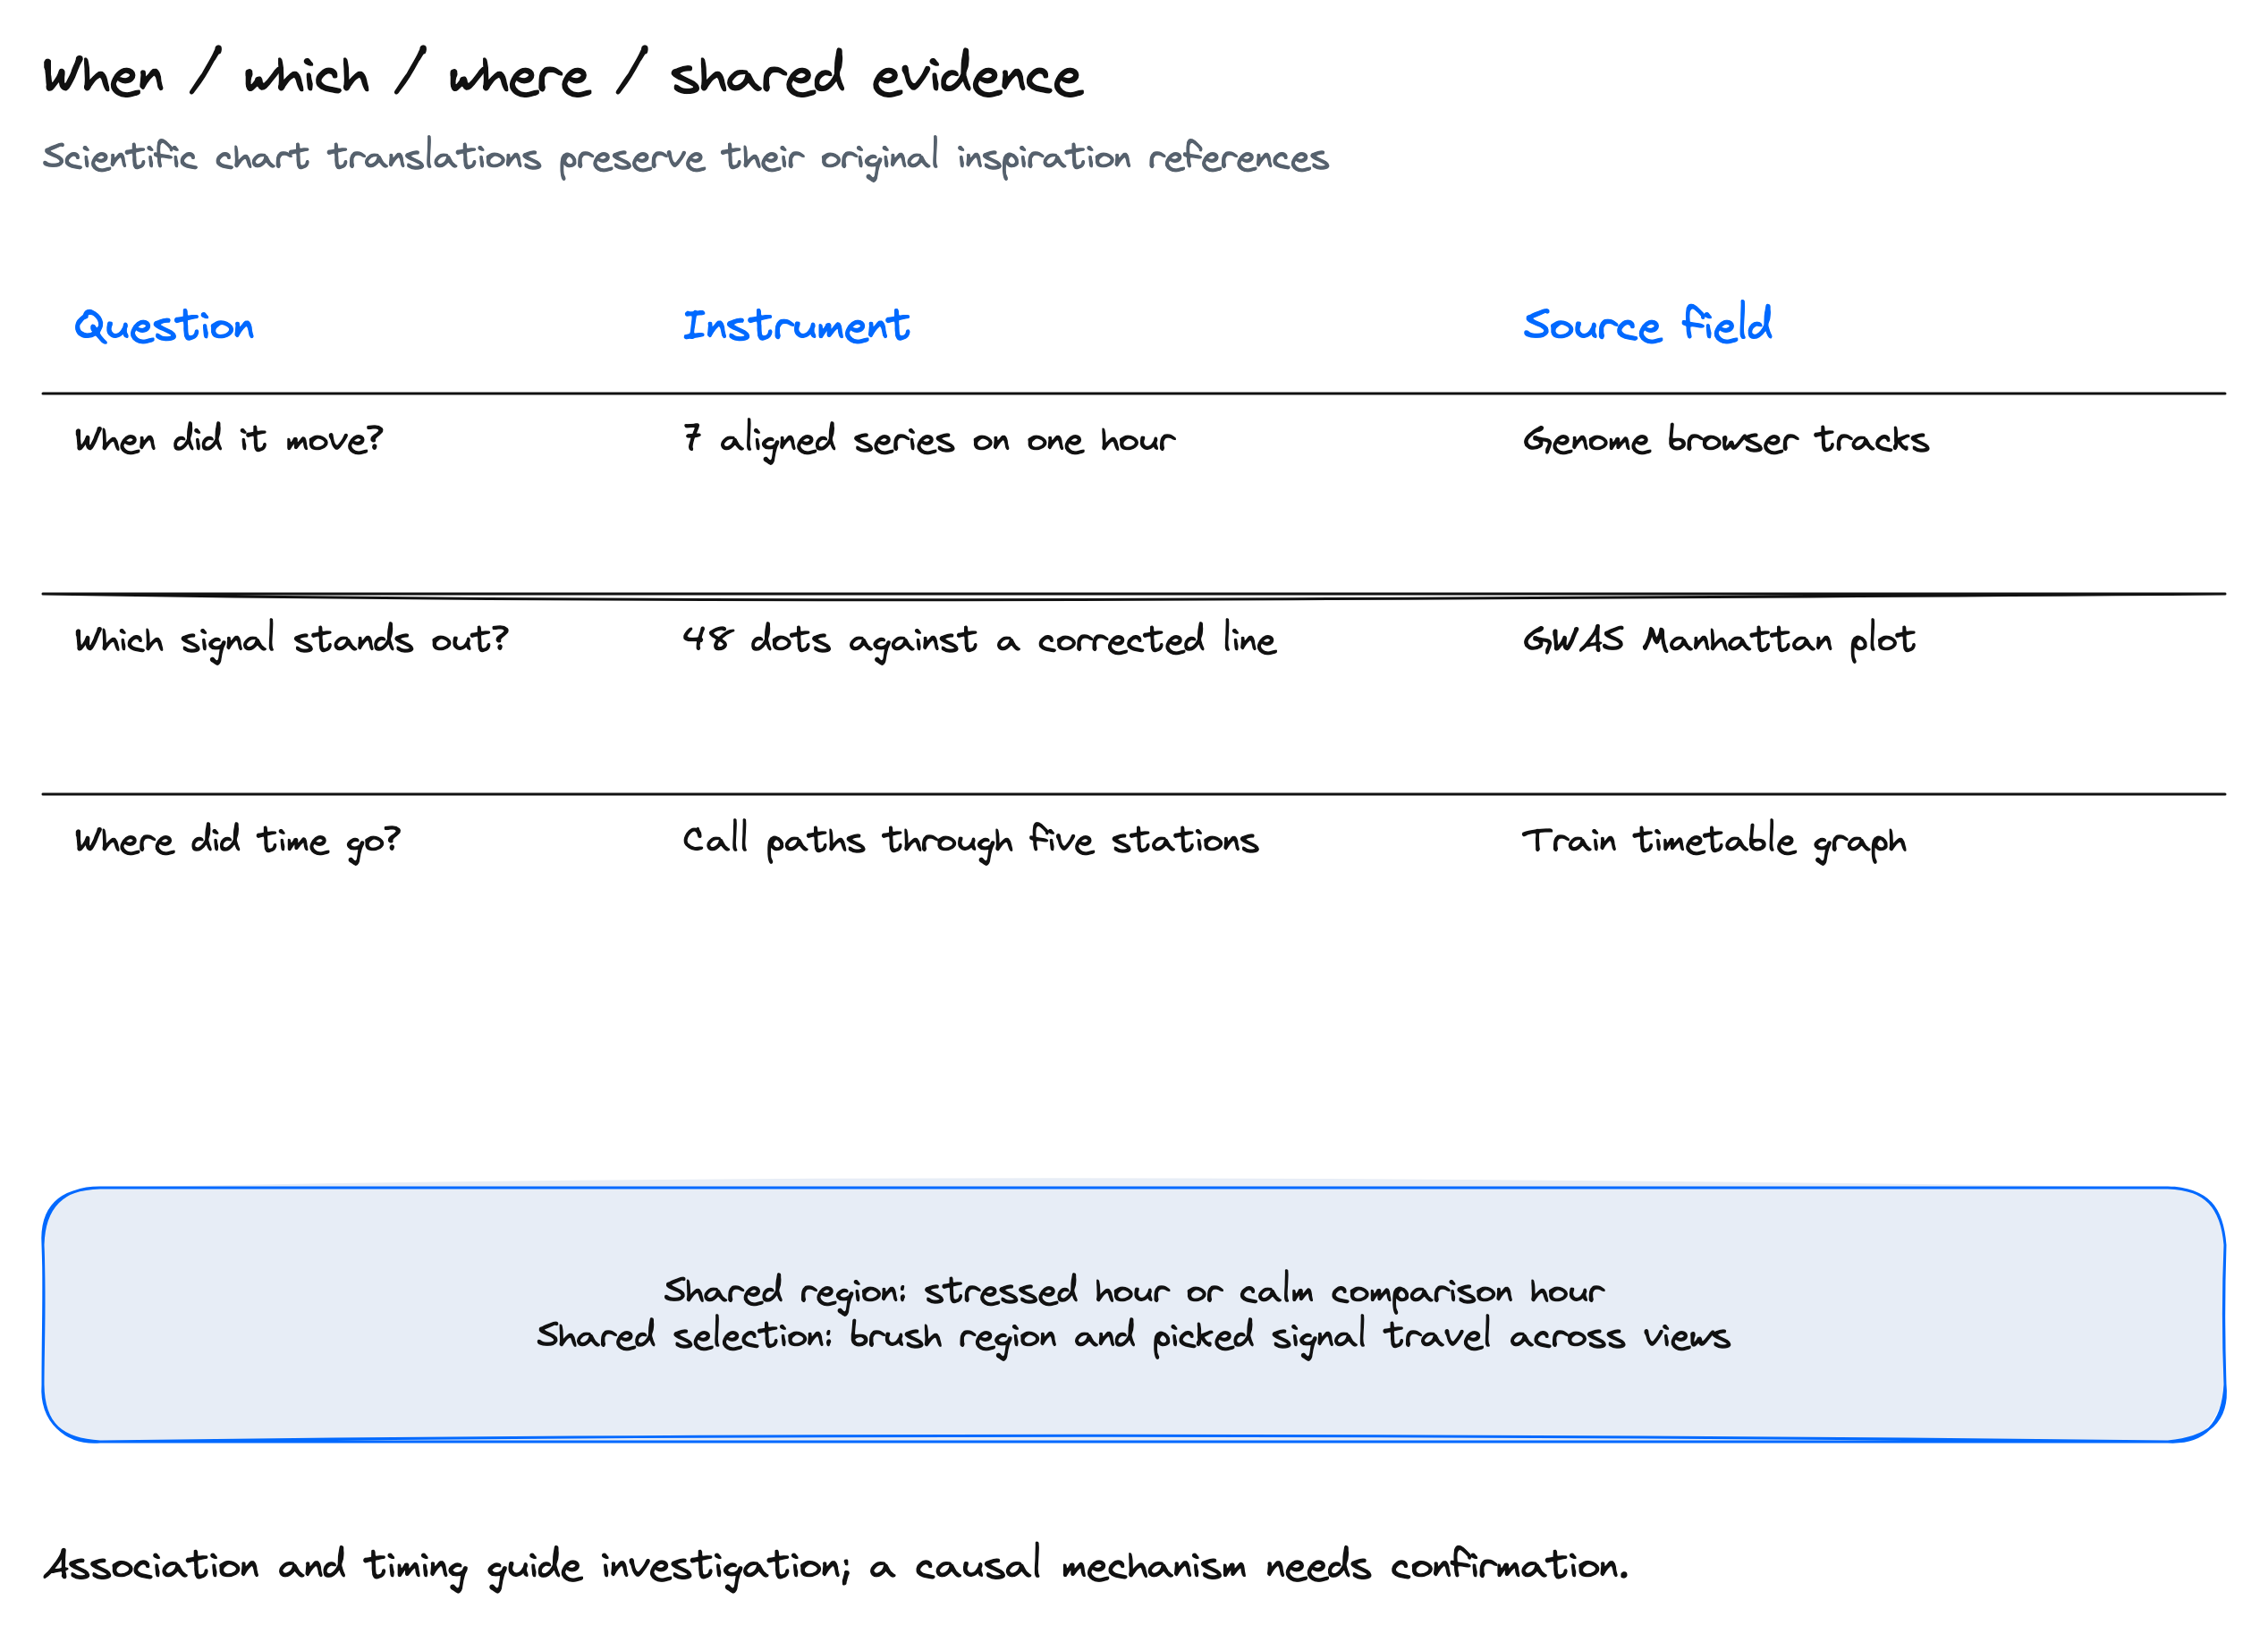
Read the diagram as text
- Question
- Instrument
- Source field
- When did it move?
- 7 aligned series on one hour
- Genome browser tracks
- Which signal stands out?
- 48 dots against a corrected line
- GWAS Manhattan plot
- Where did time go?
- Call paths through five stations
- Train timetable graph
- Shared region: stressed hour or calm comparison hour
Shared selection: brush region and picked signal travel across views - Association and timing guide investigation; a causal mechanism needs confirmation.
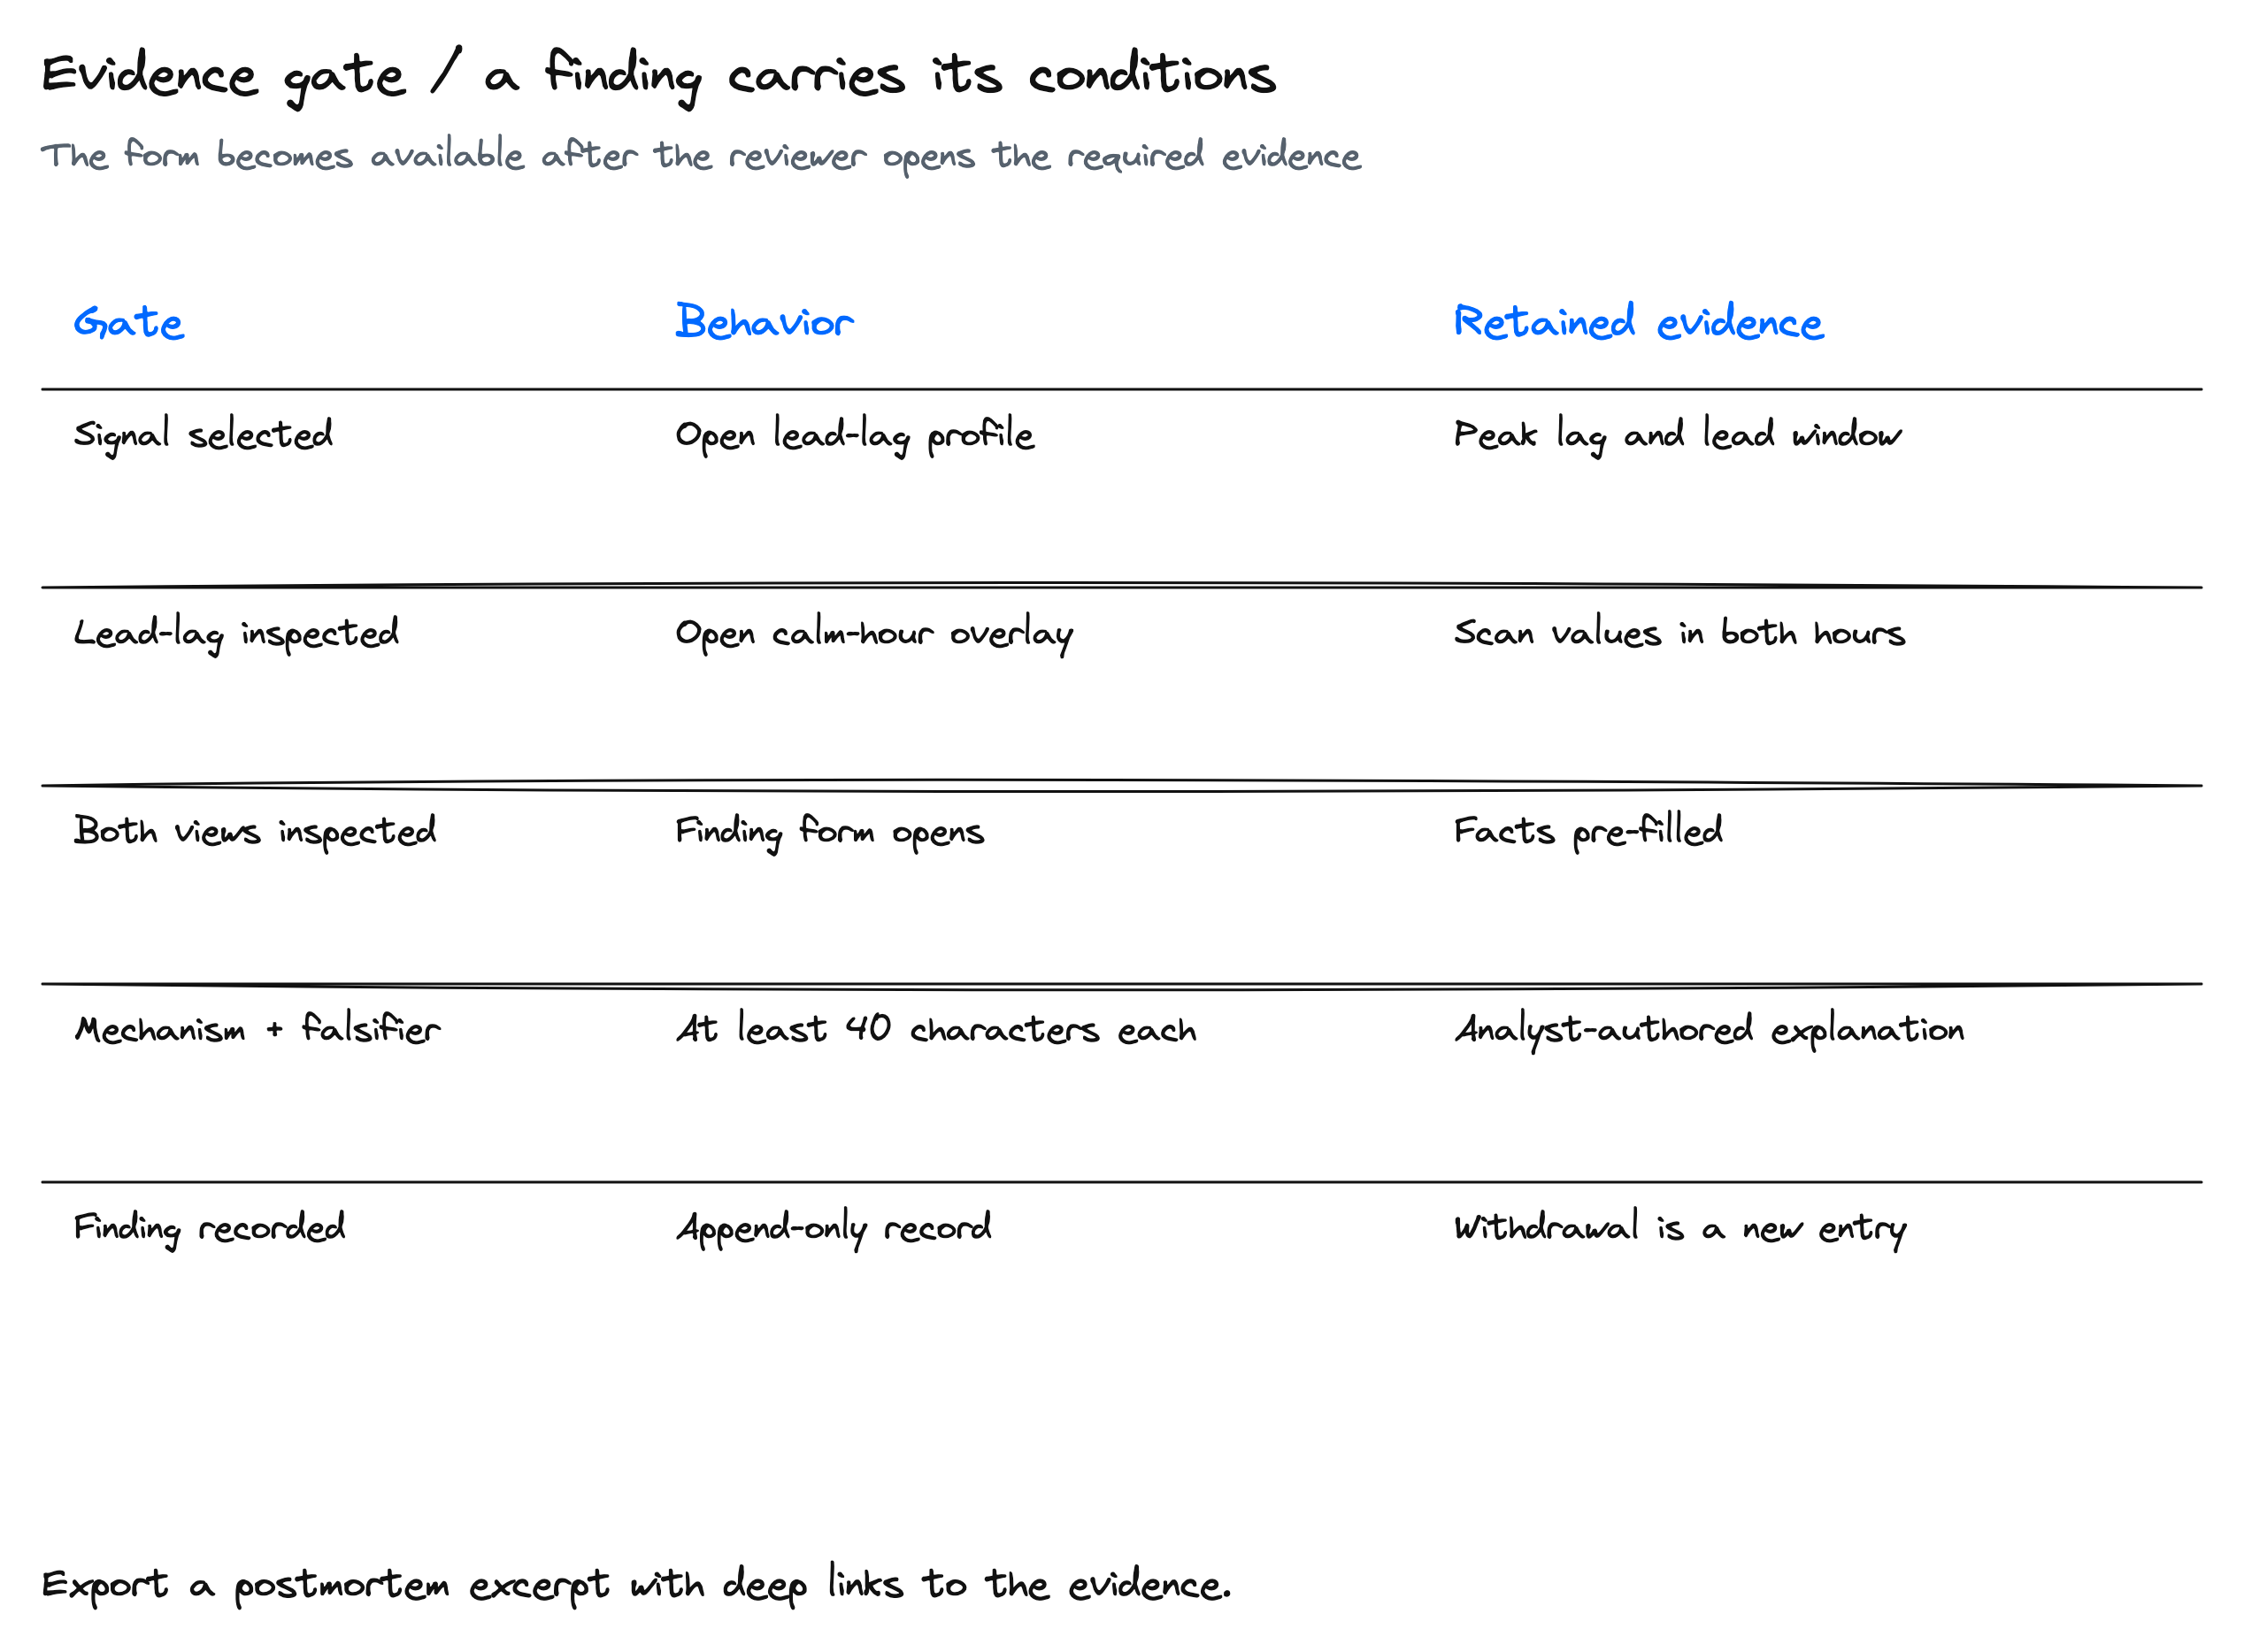
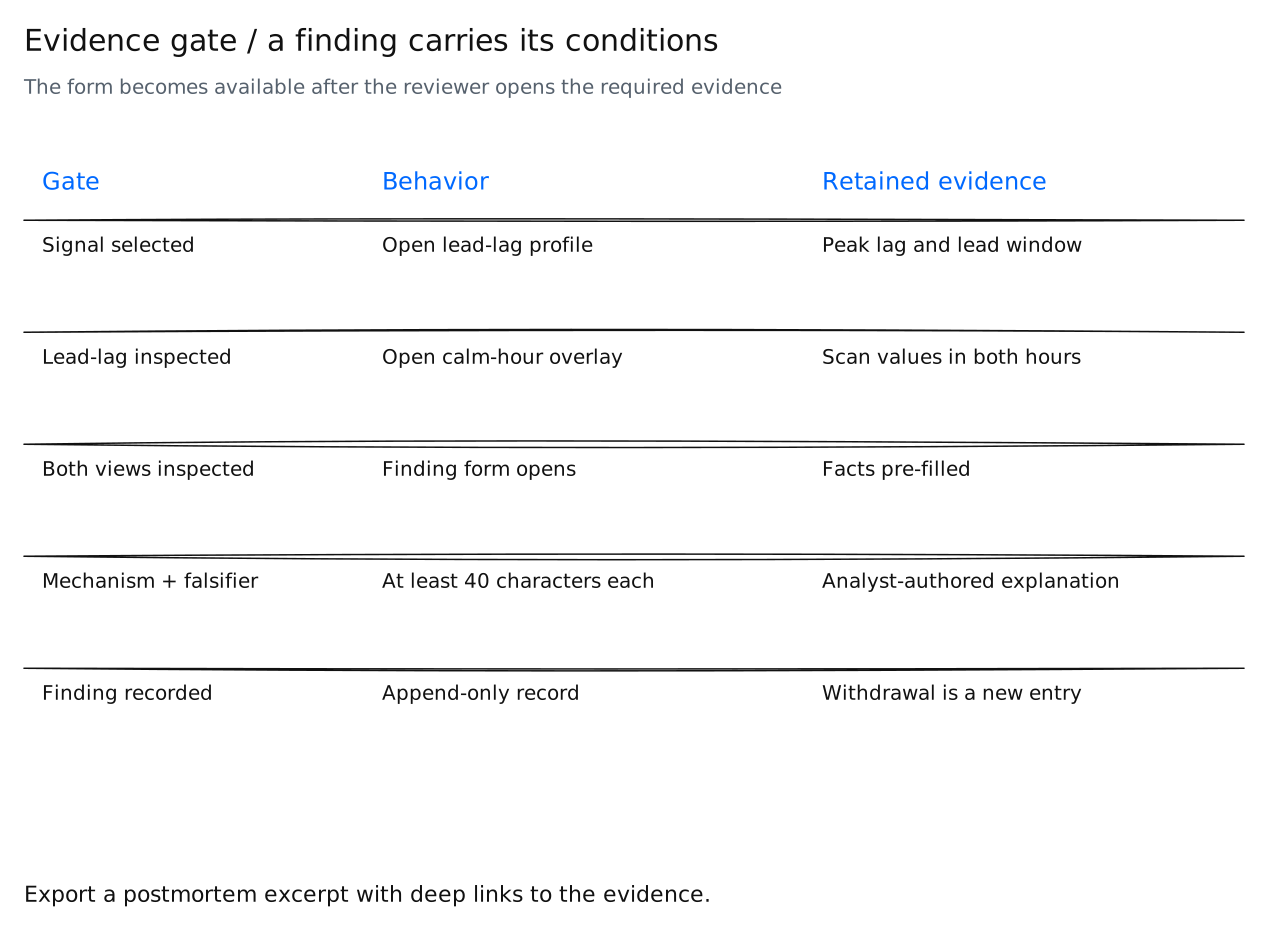
Evidence gate / a finding carries its conditions
The form becomes available after the reviewer opens the required evidence
Read the diagram as text
- Gate
- Behavior
- Retained evidence
- Signal selected
- Open lead-lag profile
- Peak lag and lead window
- Lead-lag inspected
- Open calm-hour overlay
- Scan values in both hours
- Both views inspected
- Finding form opens
- Facts pre-filled
- Mechanism + falsifier
- At least 40 characters each
- Analyst-authored explanation
- Finding recorded
- Append-only record
- Withdrawal is a new entry
- Export a postmortem excerpt with deep links to the evidence.
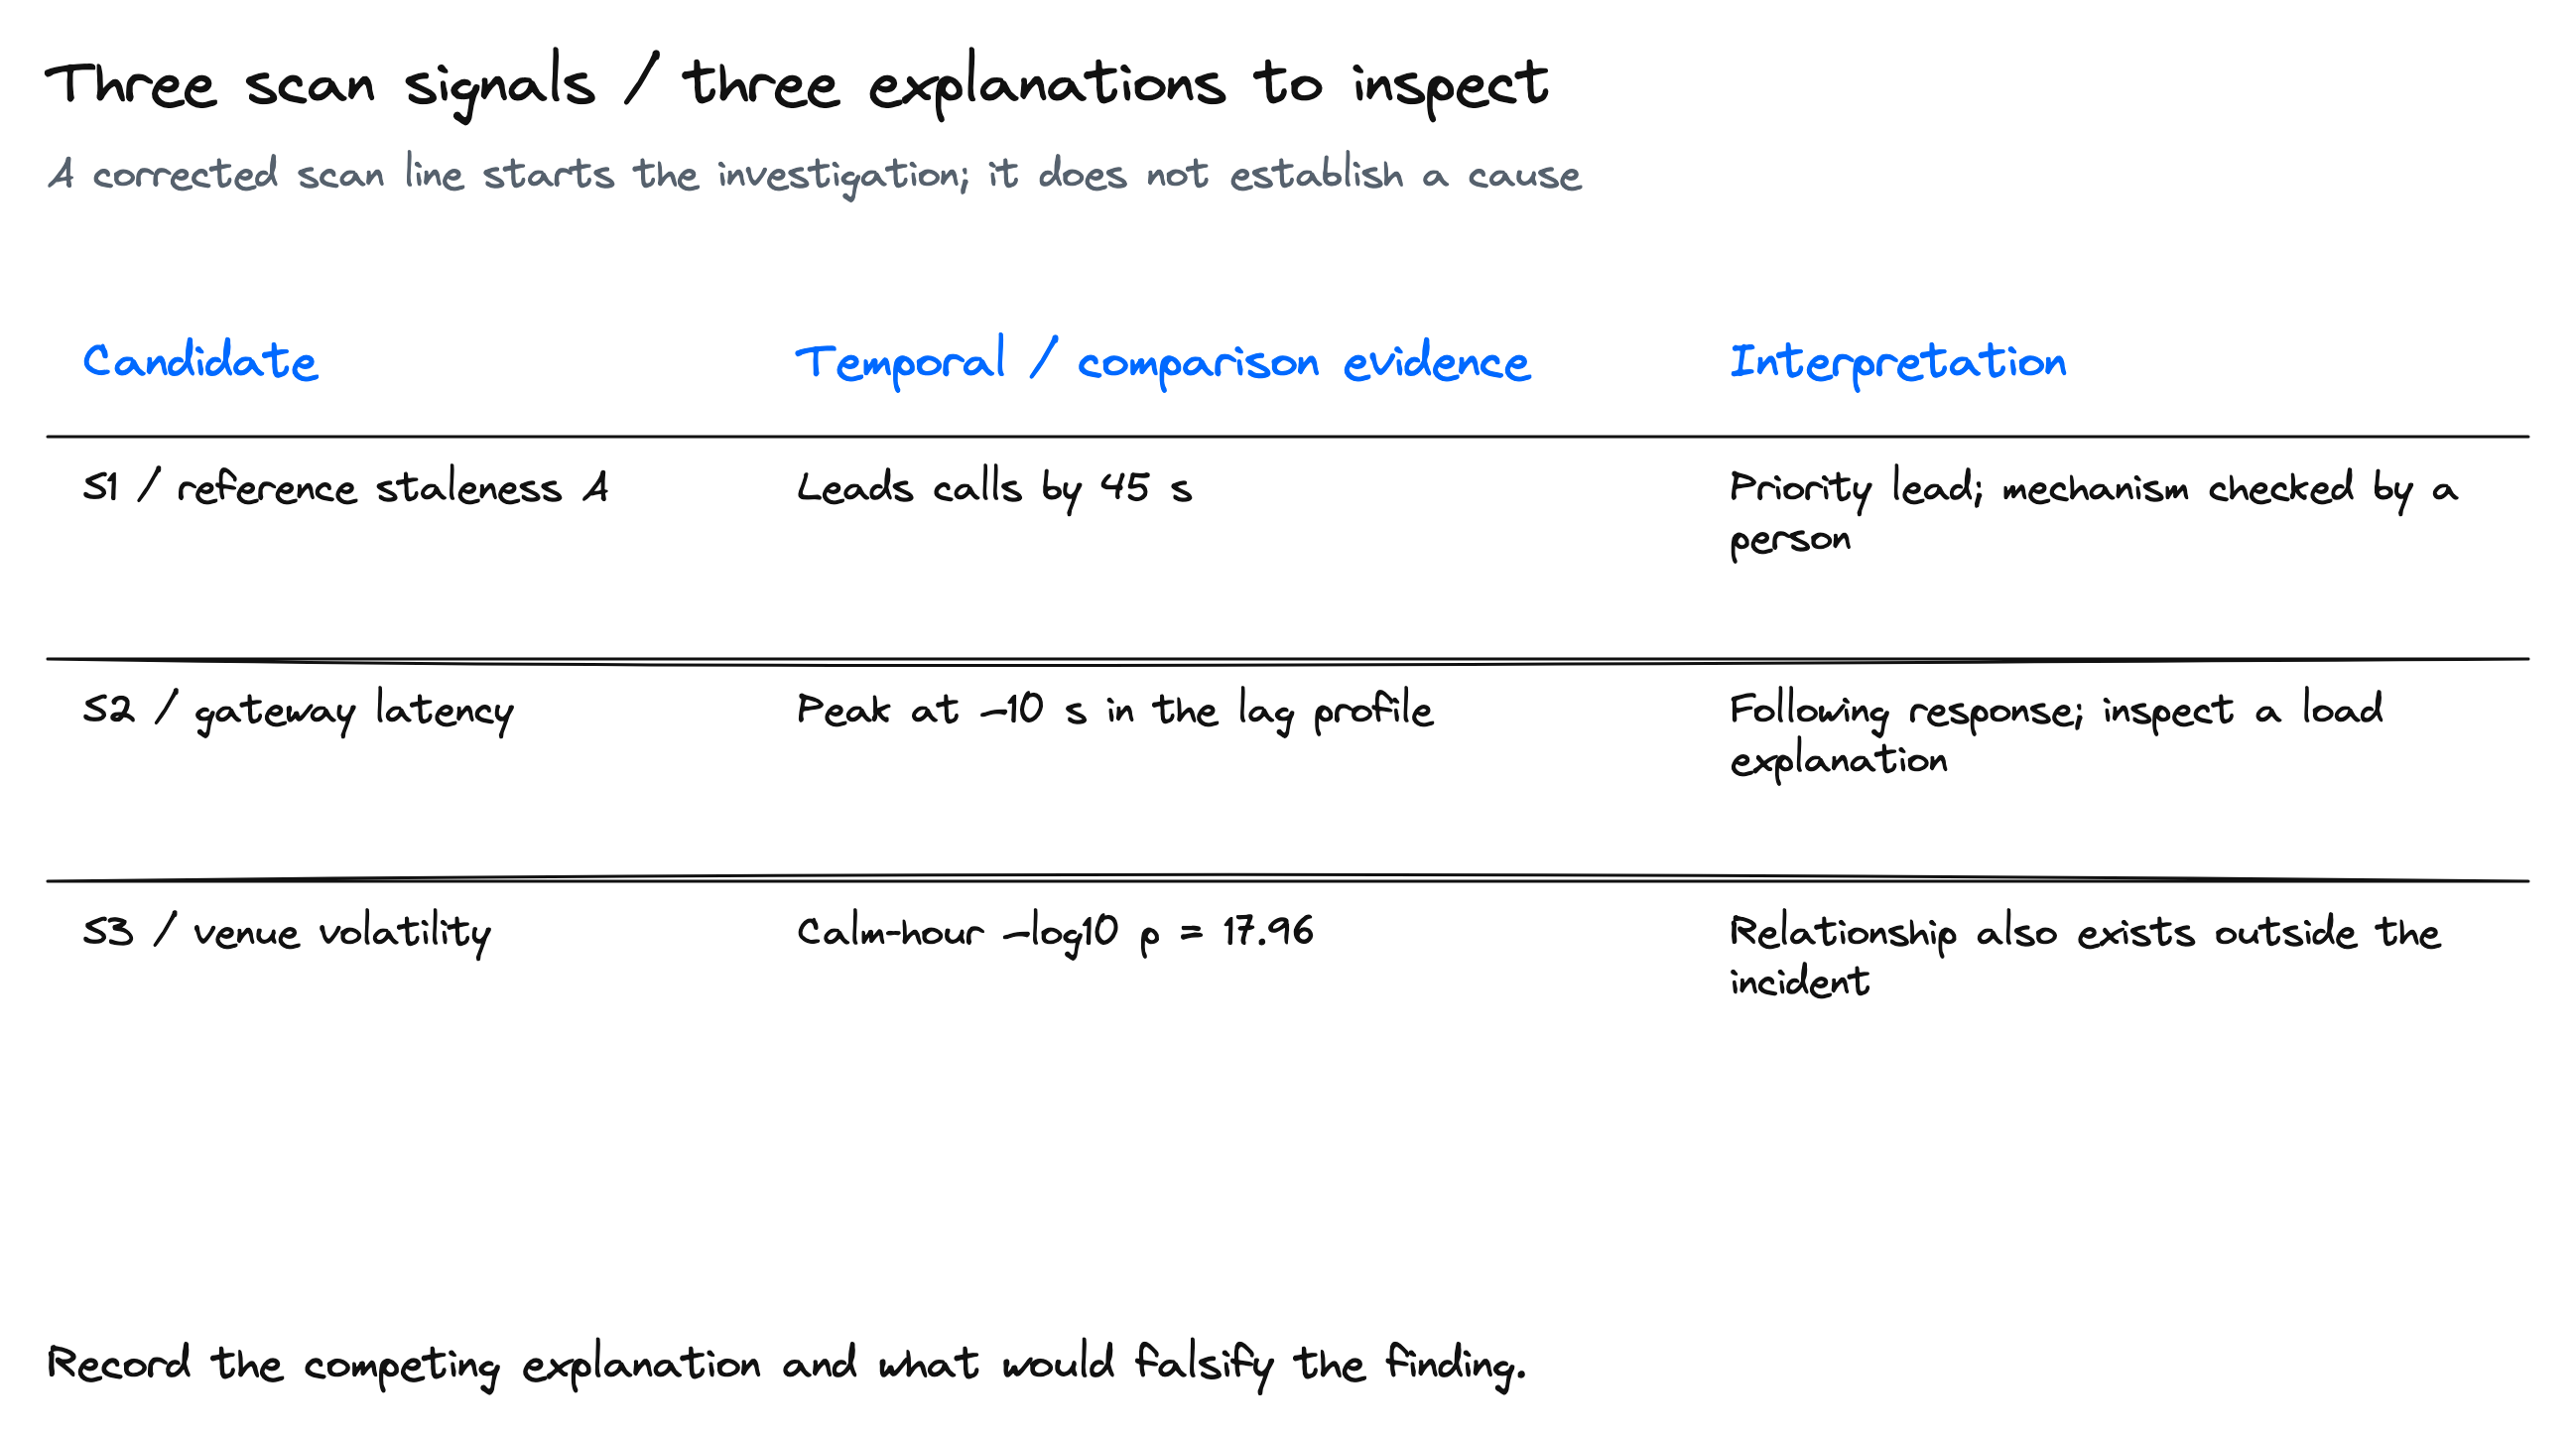
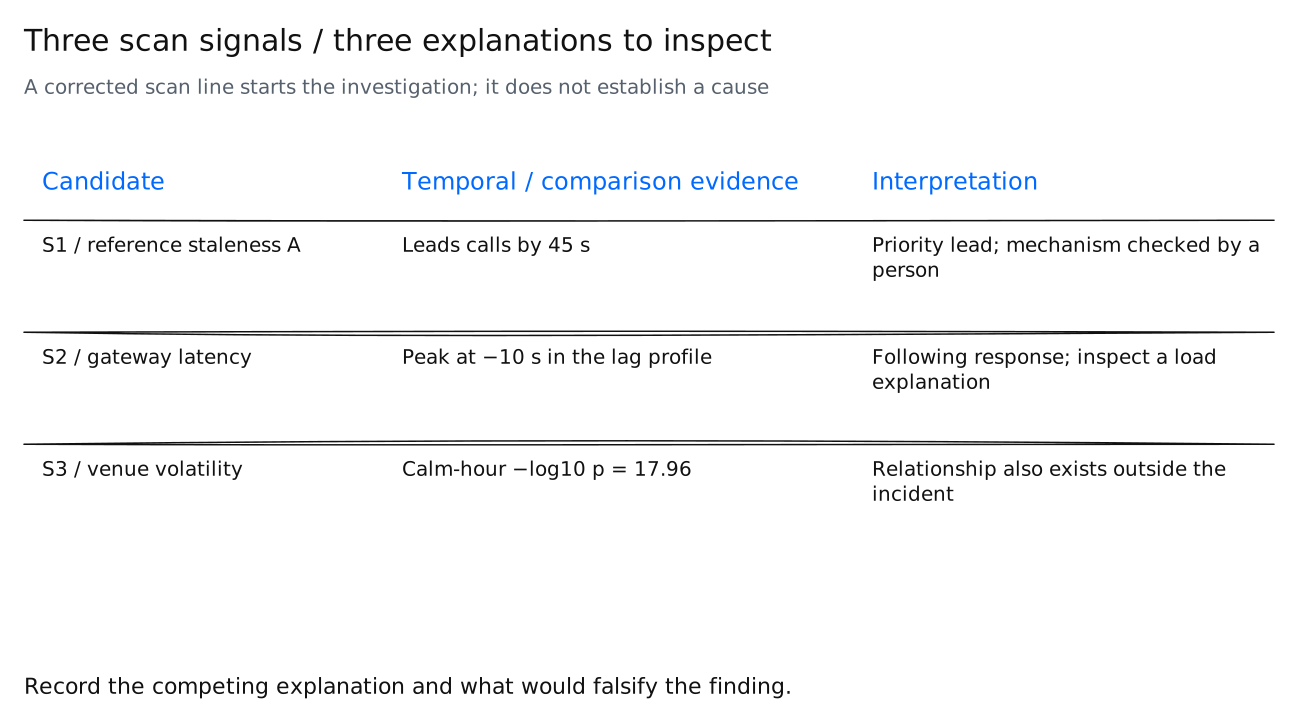
Three scan signals / three explanations to inspect
A corrected scan line starts the investigation; it does not establish a cause
Read the diagram as text
- Candidate
- Temporal / comparison evidence
- Interpretation
- S1 / reference staleness A
- Leads calls by 45 s
- Priority lead; mechanism checked by a
person - S2 / gateway latency
- Peak at −10 s in the lag profile
- Following response; inspect a load
explanation - S3 / venue volatility
- Calm-hour −log10 p = 17.96
- Relationship also exists outside the
incident - Record the competing explanation and what would falsify the finding.