What Moved First
After a stressed hour, a margin operations lead has to explain why 200 margin calls went out in 1 burst and where their collateral got stuck. I built a review workspace that answers when, which, and where with 3 instruments borrowed from other fields, and it will not record a finding until its direction and a calm-day comparison have been checked.
- Incident review
- Risk operations
- Data visualization
- Statistical evidence
- Margin operations
- Information design
The postmortem that starts with a conclusion
01 · Failure contextIncident reviews are written under pressure, and the first plausible culprit tends to become the finding: the thing that spiked at the same time. Co-movement is easy to see and easy to over-read. A signal can rise because of the incident (load after the burst), or rise every day without causing anything (ordinary volatility). Telling those apart is a mechanism question, and the review has to answer it before it names anyone.
Co-movement settles the argument too early. I want the review forced into an order: when each thing happened, on 1 clock; which upstream signal stands out from chance; and where in the call’s lifecycle the time went, with the record button withheld until the direction check and the calm-day comparison are done.
- Role
- Product designer. I designed the incident-review workflow, aligned evidence tracks, association scan, and margin-call lifecycle view.
- Workflow
- Margin operations: distinguish a leading signal, a downstream response, and a stalled handoff before recording a finding.
- Data coverage
- 2 hours at 5-second resolution, 7 tracks, 48 comparisons (12 signals across 4 windows), 300 margin calls.
- Verification
- The model checks time alignment, scan values, and lifecycle durations. The reviewer protocol tests findings against competing explanations.
- Related products
- Duco connects exception investigation to root-cause work. Nasdaq Calypso covers margin and collateral workflows. This workspace links statistical association to temporal and process evidence.
Inspiration. 2 essays from July 2025 that borrowed chart types from other fields: the genetics translation essay and the transportation translation essay.
Ask when, which, and where in that order, and do not write down a cause until direction and a calm day have had their say.
3 questions, 3 borrowed instruments
02 · Scope- When did each thing happen, on 1 clock?
- Which upstream signal stands out from chance, and does it lead or follow?
- Where in the call’s lifecycle did the time go?
Align · scan · check direction · check a calm day · trace the process · record.
Evidence before a finding
Read the decision flow
- Align the incident and candidate signals
- Inspect the association scan
- Check whether the candidate leads or follows
- Compare the calm hour
- Name the mechanism still needing confirmation
1 hour, 7 tracks, 48 comparisons, every call drawn
03 · The prototypeThe workspace answers the 3 questions with 3 views that share 1 selection. When stacks the 7 tracks over 1 hour at 5-second resolution on 1 clock, with a shared brush and cursor; the reference price track draws its update ticks as marks, so a pause in the feed reads as a gap. Which scans 48 comparisons (12 upstream series across 4 lead windows) against a stated threshold, and a pinned signal shows its lead-lag profile beside the plot. Where draws every margin call as a line through 5 stations, so a stop reads as a flat segment. Brush a region in When and Which and Where read from the same region.
The Findings form will not accept a signal finding until 2 checks are done: the direction check, with the signal’s own profile pinned on screen, and the calm-day comparison, with the placebo overlay turned on. The form says which check is missing while the gate is closed. The same association scan also runs on a calm hour as a placebo, so a signal that clears the line every ordinary day cannot pass for an incident signal. Findings are append-only: a withdrawal adds an entry and strikes the original, and nothing is ever edited.
The workspace as it opens: the 7 tracks, the freeze band drawn across the hour, and the shared cursor. Open it to brush a region, scan the signals, or follow 1 call through its 5 stations.
Authored inventory, counted from the data file
These are not user outcomes. They are counts the generator writes and the workspace reads, so each one can be checked in the table inside the workspace.
Reading the burst
04 · A worked traceWhen
The venue price falls. The reference stops ticking for 95 seconds, and the gap between them widens while the call track stays near 0. Then the feed catches up and 200 calls arrive within a minute of each other: the burst, drawn as it happened, on the same clock as the price.
Which
3 series clear the Bonferroni line, −log10 p = 2.98 or p = 0.05/48 (7 of the 48 comparisons, because neighboring lead windows of the same series move together). S2 (gateway latency) peaks at −10 seconds: it follows the calls, so the burst loaded it. S3 (venue volatility) clears the line on the calm hour too, at 18.0: it is the ordinary relationship, not a finding about this hour. S1 (reference staleness, lead 45 seconds) leads the calls and stays below the line on the calm hour.
Where
Calls through channel C2 waited a median of 11.1 minutes between collateral instruction and settlement, against 2.9 minutes for the other channels. The space-time view shows it as a flat segment: 108 C2 lines stop at the settlement step while the rest keep moving.
The 2 findings, as recorded
- Signal finding · S1
- stressed 16.72 · calm 0.33 · window 30-60 s. Mechanism: the reference stopped updating for 95 seconds, so the move was recognized late and the calls that would have trickled out fired together on catch-up; 12 calls were computed on the stale price. Falsifier: other freezes where the reference stayed current and the calls still fired together, or S1 flat on stressed hours that have no stale window. Confidence: Medium.
- Process finding · C2
- C2 · Collateral instructed to Settled · median 11.1 min · p90 12.5 min. Mechanism: the C2 channel settles through a batch step that runs on a slower cadence, so instructed collateral waits for the next batch while the other channels settle in about 3 minutes. Falsifier: C2’s last leg near the other channels when batch load is low, or C1 and C3 slowing to the same median under the same load. Confidence: High for the timing; the batch mechanism is unconfirmed with the custodian.
The Manhattan plot with S1’s and S2’s lead-lag profiles pinned together. Height is association against the threshold; only the profile shows which one moved first. The state is a deep link: instrument.html?view=which&signal=S1&compare=S2.
The placebo overlay: hollow marks are the same 48 comparisons measured on a calm hour. A dot that clears the line in both hours is an ordinary relationship; the incident signal has to separate them.
Every call as 1 line through 5 stations, with channel C2 drawn and the other channels dimmed. The flat segments at settlement are the 11.1 minute median the process finding records.
Find the stalled handoff
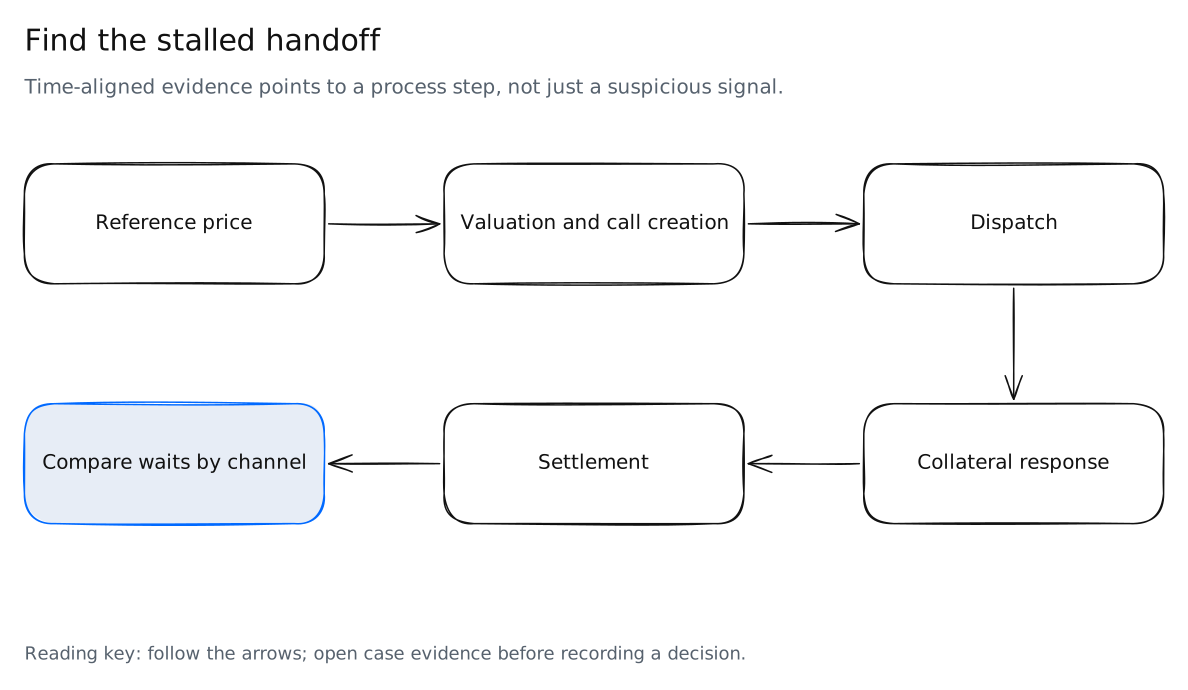
Read the decision flow
- Reference price refreshes
- Valuation creates a margin call
- Dispatch sends the call
- Collateral response arrives
- Settlement resolves the response
- Inspect duration at the stalled transition
A genome browser, a Manhattan plot, a train timetable
05 · SourceIn July 2025 I wrote 3 essays translating 28 chart types from transportation, climate science, and genetics into DeFi analytics. This workspace borrows 3 instruments from 2 of them: the genetics essay and the transportation essay, both retained in the inspiration note above.
- When · stacked tracks
- From the UCSC Genome Browser as named in the genetics essay: disparate series stacked on 1 shared axis. Here it answers when the market, the reference, and the calls each moved. What changed: the reference’s update ticks are drawn as marks, so a pause in the feed reads as a gap instead of a smooth line.
- Which · Manhattan plot
- From the same essay, which names it as the standard display for genome-wide association studies: each dot a candidate, height the strength of its association against a threshold. Here it answers which upstream signal stands out from chance. What changed: height stays association only; a lead-lag profile and a calm-hour scan sit beside every dot, and the test is corrected for seconds that are not independent.
- Where · space-time diagram
- From the train timetable graph used by 19th-century railway engineers: time on 1 axis, stations on the other, slope is speed, a flat line is a stop. Here it answers where in the call’s lifecycle the time went. What changed: each call is 1 line through 5 named stations, grouped by custodian channel, so 1 slow channel reads as 1 flat band.
The correction, stated plainly: my genetics essay called the Manhattan plot “statistical proof” of cause. It is a picture of association against a threshold, not a direction and not a mechanism. This rebuild adds the 2 checks it lacked, direction and a calm-day placebo, and leaves the mechanism to a person.
The other 25 methods from the 3 essays are kept in a ledger with a disposition for each; 1 of them, the headway control chart, became the stability control in a sibling case.
Who reads the review
06 · AudienceThe same record is read for 5 different reasons, and each reader needs a different part of it.
- Margin operations lead
- Needs a finding they can defend to the risk committee, with the direction check and the calm-day comparison attached to it.
- Risk manager
- Needs to know whether margin was computed on prices that were current at the moment the call fired.
- Market and reference data owner
- Needs which feed, which window, and how stale, down to the second, for the 95-second pause early in the hour.
- Production support
- Needs to see which latency moved with the load and which sat in front of it, so the fix is aimed at the waiting step rather than the loudest graph.
- Operational risk and audit
- Needs findings with their evidence attached, withdrawn by new entries and never edited, so the record shows its own history.
Where this transfers
07 · Same shape, other fieldsThe shape is a timed incident, a candidate list, and a process with steps. Any review with those 3 parts reads the same way.
- Site reliability postmortems
- Deploys, error rates, and saturation on 1 clock, with the deploy checked for direction before it is blamed.
- Clinical adverse-event review
- Exposures and outcomes aligned on 1 timeline, with a comparison period standing in for the calm day.
- Payments outage review
- Where in the payment’s lifecycle the time went, by channel and step, through the same station lines.
- AI agent incidents
- Tool calls, retrievals, and outcomes on 1 timeline, with direction checked before blame lands on a model.
3 decisions
08 · Trade-offs- Precomputed scans over live recomputation
- Fast and checkable against the data file, but brushing a new region does not re-run the statistics, and the tool says so on screen instead of quietly reusing the old numbers.
- An approximate autocorrelation adjustment over textbook p-values
- Fewer effective observations and weaker results, but honest when consecutive seconds are not independent. A permutation test was the first choice; over 1 hour it cannot reach the significance line at all, which is its own lesson.
- A gate before a finding
- 2 extra clicks on every record, but no finding gets written down without a direction check and a calm-day comparison first.
The scan covers 12 signals and 48 comparisons. With thousands, Bonferroni hides real leads; the next version moves to a false discovery rate and shows the expected number of false findings next to the line.
What the model establishes
The scan contains 12 upstream series tested across 4 lead windows: 48 comparisons in the correction family. Effective sample size is estimated from lag-one autocorrelation; the association scores and Bonferroni line are approximate. Null-distribution calibration is still needed. Lead-lag and placebo checks guide investigation and do not establish causation.
What I would measure
09 · The study this needsThe workspace makes an argument. It has no evidence from readers yet. This is the study I would run before calling the order better, with the pass line set before any session.
- Participants
- 5 to 8 people who run or review incidents in trading operations, risk, or production support.
- Task
- Find the cause of the burst and the stalled step, in this workspace and with a baseline of separate charts plus a call log, counterbalanced.
- Measures
- Correct signal, correct step, decoys accepted (S2 and S3), time to each answer, stated confidence.
- Pass line
- Fewer decoys accepted with no loss of correct findings. Set before any session, so the line cannot move after the data arrives.
How it is built
10 · Stack and craft- 1 workspace page with local D3 and hand-built SVG. No framework, no network calls. It runs from a file as well as from a server.
- 1 seeded generator also runs the association scan, and a small build step injects the data, so the charts, the record, and this page agree. Reruns are byte-identical.
- Findings are append-only: a withdrawal adds an entry that strikes the original, and nothing is ever edited.
- Deep links select any view, hour, signal, comparison, channel, region, and guide step, and update without polluting drawer history.
- Keyboard cursor with announced values, focusable dots, a table twin for every chart, a 12px text floor, and no animation. Built to a WCAG 2.1 AA target, not audited.
- Diagram sources: editable Excalidraw files with SVG and PNG exports.