
Same Rate, Different Weather
5 yield pools average the same 12.0% APY over a year. Their typical days, losing days, and history look nothing alike. I designed a linked research workspace where an analyst choosing a pool for a 30-day hold can see the distribution behind the rate and follow it into the daily history.
- Data visualization
- Yield research
- Distribution design
- Fintech
- Explorable explanation
- D3.js
An average cannot describe the path
01 · Failure contextA rate describes how much on average. It does not say what a typical day looks like, how often yield turns negative, or how much history supports the number.
The same 12.0% average can come from a stable daily yield, brief incentive campaigns, a wide spread through negative days, or 2 separate regimes. A smooth distribution can also conceal that the entire history is only 21 days long. The headline looks identical in every case.
The revised instrument keeps the benchmark, distribution, sample size, and chronological history connected to the same selected pool.
- Role
- Product designer. I designed the linked rate-research workspace, chart inspection, evidence reveal, and comparison workflow.
- Workflow
- Yield research: compare rate variability, history length, and persistence before choosing which evidence supports a decision.
- Data coverage
- 5 constructed daily APY histories, July 2024–June 2025. 4 pools have 365 observations; 1 has 21. Every mean rounds to 12.0%.
- Verification
- Shared calculations verify chart statistics and reveal behavior. The reader protocol tests how distribution and chronology change a choice.
- Related products
- LSEG Workspace connects financial research, charts, and analytical context. This workspace links quoted rates to raw observations, distribution shape, and chronology.
3 questions before you pick a pool
02 · ScopeTypical day. How far is the median from the advertised average?
Downside and shape. Are negative days ordinary, and does the distribution contain separate regimes?
Evidence. How many observations support the shape, and what changes when the order of days matters?
Compare the rate · inspect the distribution · follow the history · reconsider the horizon.
From a matching rate to different evidence
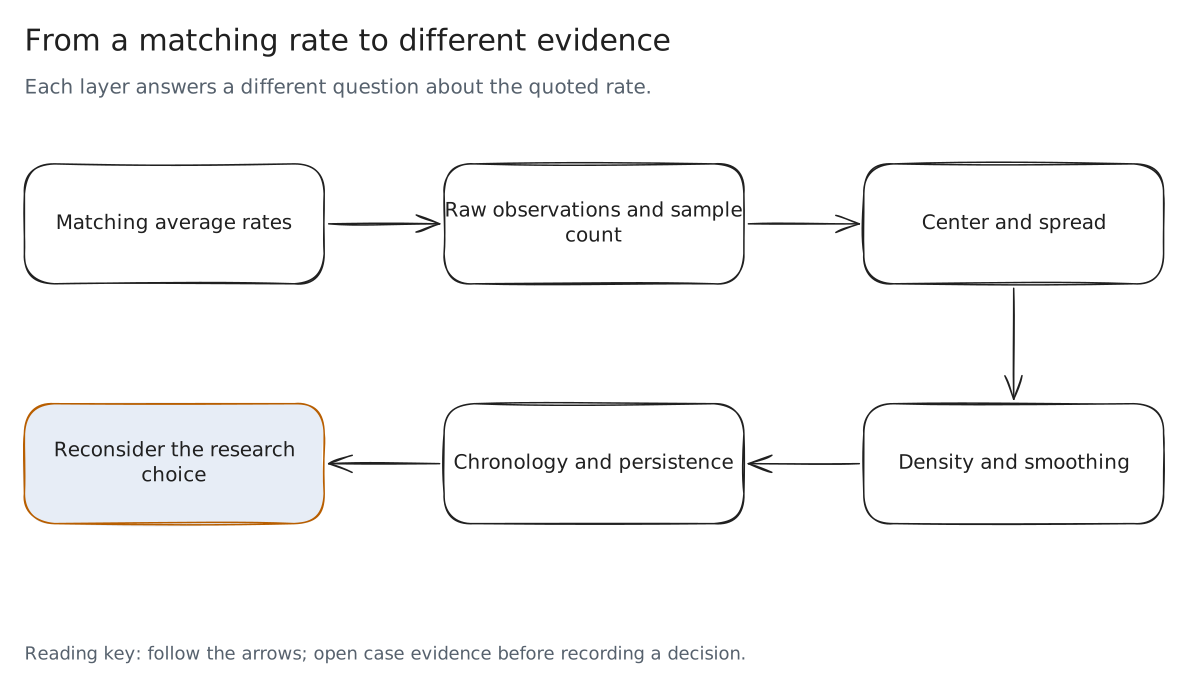
Read the decision flow
- A quoted average begins the comparison
- Raw observations expose the range and sample count
- Box summaries locate central spread
- Density exposes shape under a chosen bandwidth
- Chronology tests whether the pattern persists
5 pools, 1 rate, linked evidence
03 · The prototypeThe watchlist keeps all 5 headline rates visible. Select a pool to link its raincloud, statistics, daily history, and 30-day windows. The orange selection follows the evidence across the workspace; red marks observations below 0% APY.
The monitor opens with the complete distributions. A separate guided reveal records a choice on the rate alone before introducing the box, cloud, observations, and holding horizon. Neither the sidebar nor the history chart exposes the later layers early.
The linked yield research workspace
What the 5 pools hide
3 layers and a 30-day horizon
04 · A worked traceThe box first. It gives the median, middle 50%, and 1.5 × IQR whiskers. It exposes pool A’s typical day at 5.5% and pool D’s lower whisker at −26.0%. Pool E’s box runs from 7.3% to 16.6%, almost exactly its 2 regime centers, so on its own it reads as 1 wide spread. The average stays drawn as a dashed benchmark, with a separate mean marker.
The cloud adds the distribution’s shape. Pool E’s median is 11.4%, but only 2 of 365 observations fall within 1 APY point of it. Per-pool smoothing exposes peaks near 7.3% and 16.6%. A central summary does not describe either regime.
The box reveals the mismatch
The cloud separates regimes
The rain is the evidence count. Pool C has 21 daily observations; the other 4 have 365. Its smooth cloud looks established until the observations and sample count are exposed. Pool B is the control: 321 of 365 days sit within 1 APY point of its median.
A smooth cloud with only 21 days behind it
A raincloud describes which yields occurred. The daily history describes their order. That distinction matters when a person plans to hold for 30 days: a run of low-yield days can be hidden by the full-year average.
The instrument computes every overlapping 30-day window from the same observations. Pool B’s average annualized yield stays between 11.4% and 12.4%. Pool A ranges from 5.2% to 29.0%; pool D ranges from 1.8% to 25.3%. Pool C has no complete window.
Every complete 30-day window
The guided reveal ends by asking for another choice. It retains the original pick and reports whether it changed after the evidence. The interaction makes the reader’s reasoning inspectable without declaring a universal best pool.
An annualized rate is not a cash return
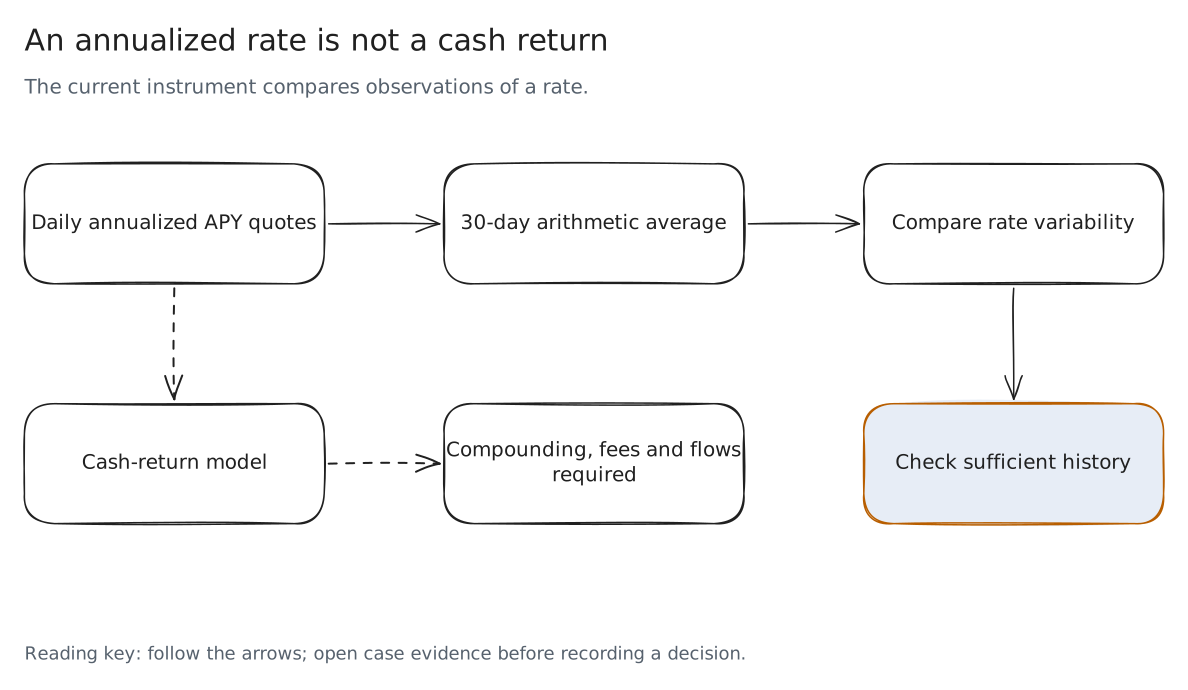
Read the decision flow
- Daily observations are annualized APY quotes
- A 30-day window averages those quotes
- Overlapping windows reuse observations
- Cash returns require a compounding and fee model
- Insufficient history remains an explicit result
Make the chart’s omissions visible
05 · The revisionIn July 2025, I explored this in a post, an article, and a 95-second demo. The argument was stronger than my chart: it criticized averages without drawing the average, and its log view could hide the negative observations. This case is the revision.
The 2025 chart used random data on each load, 1 fixed smoothing width for every pool, and a log option that silently dropped nonpositive yields. I replaced those choices with seeded observations, per-pool smoothing, a counted focused range, and a symmetric-log option that preserves negative values.
The chart settings keep the earlier choices available for inspection. The 2025 setting, a fixed bandwidth of 7 APY points with its own kernel, merges pool E’s 2 peaks into 1. The log view excludes 76 nonpositive observations. A visible warning reports that omission while the statistics and history retain the full data.
Inspect what the earlier settings hide
- Clipping
- The focused axis is −25% to 50%. Lane-edge counts identify observations outside it; full range reveals their positions.
- Smoothing
- Each pool gets its own bandwidth from Silverman’s rule of thumb, computed from its spread. The density is an estimate; individual observations and box summaries remain available.
- Stability
- The same seeded daily values and jitter survive reloads, resizing, and selection changes.
What the model establishes
The values are daily annualized yields. Negative days stand for realized losses, which a quoted APY would not show. The 30-day windows are arithmetic averages of those annualized quotes; they are not compounded holding returns or forecasts. Quantiles, category counts, and individual observations come from the same supplied dataset. The distribution explains spread and overlap; it does not predict the next week.
Who reads the distribution
06 · Audience- Yield or treasury analyst
- Which pool’s typical day matches the rate, and how much history stands behind it.
- Product manager for a savings or staking product
- How the rate shown to customers compares with the path they will live through.
- Risk manager
- How often the yield turns negative and how low a 30-day window can fall.
- Investment committee member
- A choice they can defend from the distribution, not the headline.
- Disclosure or compliance reviewer
- Whether a quoted rate needs its range, history length, or negative days stated next to it.
Where this transfers
07 · Same shape, other fieldsAny rate that is quoted as 1 average but lived as a path reads better as its distribution and its history, linked to the same selection.
- Savings and money market rates
- 7-day yields that hide how the rate moved inside the window.
- Fund fact sheets
- Average annual returns next to the drawdowns and regimes behind them.
- Promotional and teaser rates
- A short campaign lifting a headline: the pattern of pool A.
- Staking and validator rewards
- Where the study started: variable rewards quoted as 1 APY.
3 decisions
08 · Trade-offs- Keep the average drawn
- The case argues against reading the average alone, but removing it would hide the comparison the reader came with. It stays as a dashed benchmark with its own marker.
- Symmetric-log, not log
- A log axis reads spikes well and drops every day at or below 0%. Symmetric-log keeps pool D’s 76 negative days on the chart, at the cost of a less familiar axis.
- Clouds scaled to their own peak
- Each shape is legible, but a 21-day pool looks as solid as a 365-day pool. The rain and the day count carry sample size, and an observation-weighted option is 1 setting away.
Where I expect to be wrong. Readers may still choose the pool with the highest box. If fewer than half change their 30-day choice after the reveal, the next version opens with the 30-day windows instead of the cloud.
What I would measure
09 · The study this needsThe workspace makes an argument. It does not yet have evidence from readers. This is the study I would run before calling it better, with the pass line set before any session.
- Participants
- 5 to 8 people who choose or explain yield products: treasury and yield analysts, product managers for savings or staking products, and risk reviewers.
- Task
- Pick a pool for a 30-day hold from 5 equal rates, reveal the box, cloud, observations, and windows, then pick again and say why. Once in this workspace and once with a rate table and a 1-year line chart, on 2 matched pool sets, order counterbalanced.
- Measures
- Whether each participant names pool A’s low median, pool D’s negative days, pool E’s 2 regimes, and pool C’s 21 days; whether the second pick changes and its reason cites a layer; time to the second pick.
- Pass line
- Pool C’s short history and pool E’s 2 regimes named by at least 6 of 8 participants in this workspace, more than with the table and line chart, and every changed pick backed by a reason that cites a layer.
How it is built
10 · Stack and craft- Local D3 charts, native controls, linked selection, keyboard-accessible observation inspection, and a scrollable data table.
- Shared statistical functions recompute quantiles, 1.5 × IQR whiskers, density peaks, and overlapping 30-day averages from the original seeded observations.
- CSV export retains all 1,481 observations, their dates, pool identity, annualized APY, and designed-data flag.
- All runtime assets are local. The case and prototype work from a direct file or a local HTTP preview.
- Diagram sources: editable Excalidraw files with SVG and PNG exports.
The raincloud follows the approach of Allen et al. (2019) and the implementation discussion of Ott et al. (2025), credited in the original study. The workspace connects those layers to the analyst’s selection and chronological evidence.