
Landslide or Coin Flip
A proxy team’s projection sheet says 54.0% of votes will be for the proposal, and that number cannot say whether the vote is safe. I rebuilt my January concept video as a forecast that simulates 1,000 meetings from stated assumptions, draws them against the threshold, and names the assumption that breaks the outcome. On this data the same projection passes in 57.3% of meetings counted against votes cast and in 1.0% counted against shares outstanding.
- Vote forecasting
- Corporate governance
- Capital markets
- Monte Carlo simulation
- Data visualization
- Decision records
54% for, and nobody knows if it is safe
01 · Failure contextA projection sheet sums the expected votes of each holder and prints 1 number. It cannot show that one holder votes as a block, that retail turnout is a guess, or that a proxy advisor’s recommendation can tilt several holders at once.
The team then decides whether to keep spending on solicitation from a number that hides all 3. It also hides the question underneath: 54% of what? Counted against votes cast, a quiet retail base is harmless. Counted against shares outstanding, every share that is not voted works against the proposal.
- Role
- Product designer. I designed the vote projection, assumption controls, sensitivity inspection, and solicitation decision with watch triggers.
- Workflow
- Proxy solicitation: identify the assumption that changes the decision under the selected voting standard.
- Data coverage
- An invented issuer with 5 holder blocks and 1,000 simulated meetings, seed 20261005.
- Verification
- Seeded model checks cover vote denominators, sensitivity, and break-even triggers. The evaluation protocol tests assumption-led decisions.
- Related products
- Broadridge Issuer Proxy connects shareholder insight, engagement, and vote monitoring. This workspace makes a projection’s assumptions and decision thresholds inspectable.
Inspiration. My January 2026 article Governance isn’t a Line. It’s a Landscape. and its short concept video.
Read the forecast against the threshold that applies, and spend effort on the assumption that decides it.
3 questions before you stop soliciting
02 · ScopeWill it pass under the standard that applies?
How sure can we be, given what we do not know about turnout and the large holder?
Which assumption, if wrong, breaks it?
State assumptions · simulate · read against the threshold · rank what matters · decide.
A forecast becomes a solicitation decision
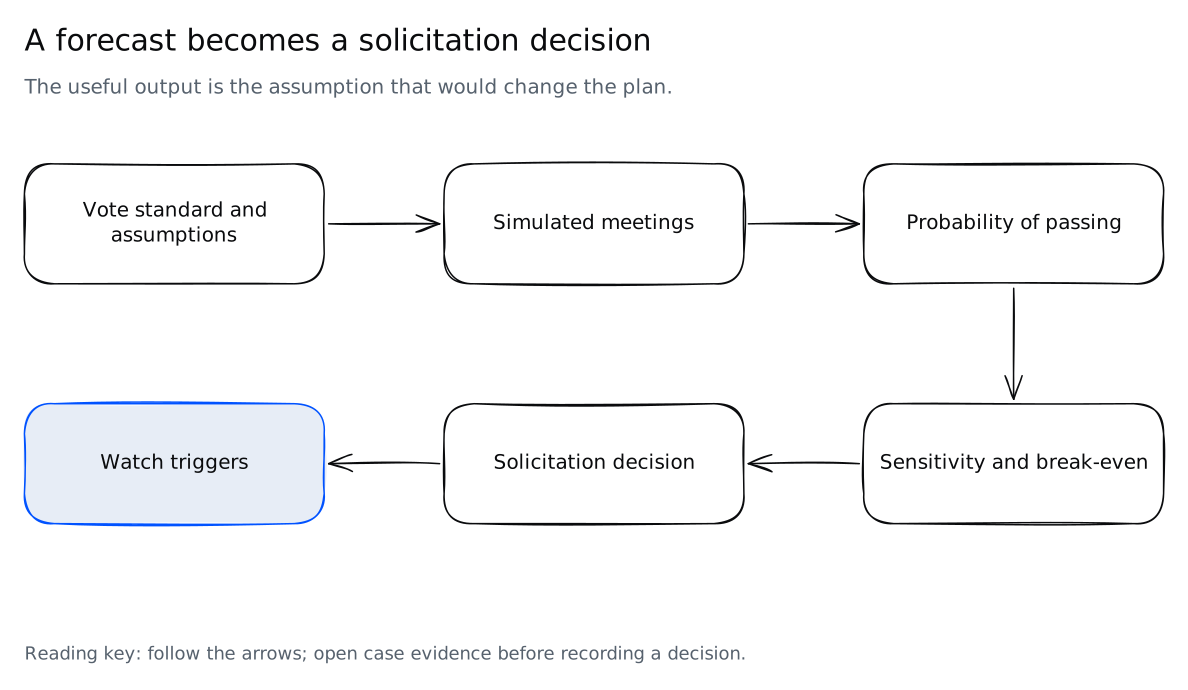
Read the decision flow
- Choose a voting standard
- State turnout, support and shared-factor assumptions
- Simulate meetings
- Find the breaking assumption
- Record solicitation and watch triggers
1,000 meetings, 1 threshold
03 · The prototypeThe workspace starts where the team already works: a table of holder blocks with their share, turnout, and support, and the projection sheet’s total under it. 6 sliders change the assumptions behind that table. Each simulated meeting draws its own turnout, support, advisor recommendation, and large-holder vote, and the histogram counts the meetings by their for share, with the threshold drawn and the projection sheet’s number marked as a short tick.
A switch counts the same meetings 3 ways: majority of votes cast, majority of shares outstanding, and two-thirds of shares outstanding. The Sensitivity view ranks the assumptions by how far each one moves P(pass) across its plausible range, and finds the break-even value where P(pass) crosses a confidence threshold. A decision is recorded with those break-even values attached as watch triggers.
The forecast workspace, live
Blue meetings pass and gray fail. Open the workspace to move an assumption, switch the vote standard, or run the guided start.
Authored inventory, counted from the data file
These are not user outcomes. They are counts the generator writes and the workspace reads, so each one can be checked in the Meetings table inside the tool.
1 projection, 3 standards, 1 deciding assumption
04 · A worked traceThe threshold first. Under majority of votes cast, 573 of 1,000 simulated meetings pass: P(pass) is 57.3%, and the for share runs from 40.4% to 65.0% between the 5th and 95th percentiles. Count the same meetings against shares outstanding and retail shares that are not voted work against the proposal; P(pass) falls to 1.0%. Under two-thirds of shares outstanding it is 0.0%.
The standard changes the question
The same assumptions and the same 1,000 meetings, counted 3 ways. Which standard applies to a real proposal is a legal question; the workspace lets the team choose it explicitly.
Then who decides it. Under votes cast the outcome is close to the large holder’s choice: every meeting in which it votes for passes, and about 3% of the meetings in which it votes against pass. The largest swing belongs to the large holder chance of voting for: P(pass) reaches 90% only if that chance reaches 90.0%. Under shares outstanding the top swing moves to active mean support, and retail turnout matters 3.1 times more than it does under votes cast. Inside the plausible ranges, no single assumption brings the outstanding vote to 90%.
Who decides the vote
Each bar runs from P(pass) at the low end of an assumption’s plausible range to P(pass) at its high end, all else held. Select a bar inside the workspace to preview its break-even.
A decision with triggers
The decision the trace supports: engage the large holder directly, rather than spend more on retail. The decision note carries its own conditions. Its 3 watch triggers are the top 3 swings and the values at which P(pass) would cross 90%, written in plain words, so the next person knows what new information should reopen it.
Why the forecast is not 1 number: the meetings form 2 groups, because the large holder votes all for or all against. With the same expectations and that uncertainty reduced (the Settled preset), P(pass) is 99.8%. The shape is not the point of this case; where it sits against the threshold is.
The denominator changes the decision
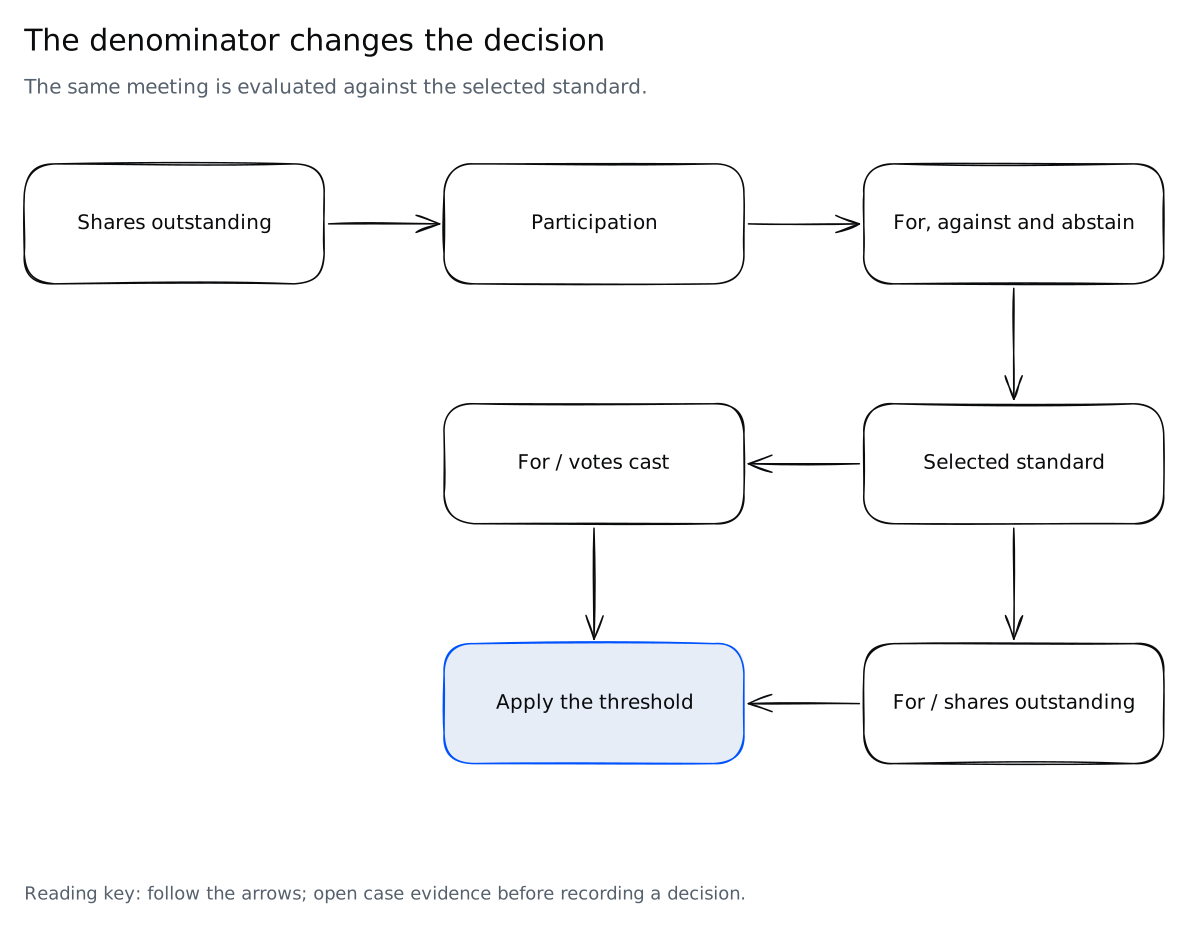
Read the decision flow
- Outstanding shares define the full population
- Participation produces cast votes
- Abstentions are excluded from the cast-vote denominator
- Evaluate for votes against cast votes or outstanding shares
- Apply the exact selected threshold
From a concept video to a model you can argue with
05 · The revisionIn January 2026 I published a concept called Compass, written for on-chain governance votes in DeFi, as an article and a short concept video: 100 simulated outcomes drawn as a glowing landscape, with 2 sliders that stretched and shifted it. Its premise still holds, in the article’s words: “A 51% vote count tells you who is winning, but not how they are winning.”
The concept stopped at the picture. This rebuild keeps the premise and changes everything a decision needs.
- Evidence
- A video became a working model in which each of the 1,000 meetings can be inspected in a table.
- Runs
- 100 became 1,000. The 100-run switch shows why: across 10 samples of 100 meetings, P(pass) spreads by 16.0 points.
- Threshold
- Left and right colors became a drawn, labeled threshold, a probability of passing, and its interval.
- Vocabulary
- Slang slider names became “large holder chance of voting for” and “retail turnout”, each with a defined effect in the model.
- Standard
- 1 implicit count became 3 explicit standards.
- Over-trust
- A silhouette that “tells the story” became a ranking of the assumptions that write it.
The sibling distinction, stated plainly: Tail Mass asks whether a chart draws the tail honestly, and Same Rate, Different Weather asks what an average hides. This case asks whether a forecast clears a threshold, and what would make it fail.
Who reads the forecast
06 · Audience- Corporate secretary or general counsel
- The standard that applies, and the risk of a failed vote.
- Investor relations
- Which holders to call, and in what order.
- Solicitation strategist
- Where the next dollar of effort moves P(pass) most.
- Board or committee
- A probability and its range, not a point.
- Stewardship analyst at an asset manager
- The same model from the voter’s side: how much one vote matters.
Where this transfers
07 · Same shape, other fieldsAny decision that waits on many parties clearing a threshold, where a few large parties and a quiet majority carry the uncertainty, reads better as simulated outcomes against the line than as 1 projected total.
- Bondholder consents
- Consent thresholds by principal amount, where a few large holders decide.
- Fund mergers
- Shareholder approvals with dispersed, low-turnout retail ownership.
- Restructuring plans
- Creditor classes, class thresholds, and holdouts.
- On-chain governance
- Where the concept started: block holders, turnout, and quorum.
3 decisions
08 · Trade-offs- 1 shared factor
- The advisor recommendation is the 1 factor that links the holder blocks. In this setup it moves them little, so the large holder dominates; a book where active funds follow the advisor closely would need a stronger coupling, and the workspace says so.
- A histogram of meetings, not a smooth density
- Blockier, but every bar is a count that can be opened in the Meetings table. A smoothed estimate is available, labeled as an estimate.
- A probability next to the shape
- It reintroduces 1 number, but anchored to a threshold, an interval, and a ranking of what moves it.
Where I expect to be wrong. People may trust a precise-looking P(pass) that rests on guessed turnout. The study measures calibration, and if confidence tracks the number more than the interval, the next version leads with the interval.
What the model establishes
Two-thirds means exactly 2/3 of shares outstanding; display rounding does not set the vote rule. The lower-uncertainty preset replaces the binary advisor and large-holder draws with expected effects and narrows turnout spreads to one quarter. Support and turnout randomness remain, and the realized mean may differ. Not modeled: the majority of shares present and entitled to vote standard, under which abstentions count against, and broker discretionary votes on routine items. Retail shares that are not voted behave like broker non-votes: excluded under votes cast, counted against under shares outstanding.
What I would measure
09 · The study this needsThe workspace makes an argument. It does not yet have evidence from users. This is the study I would run before calling it better, with the pass line set before any session.
- Participants
- 5 to 8 people from investor relations, corporate secretary offices, proxy solicitation, or asset-manager stewardship.
- Task
- 4 scenarios: decide whether to stop soliciting and where to focus, once in this workspace and once with a projection sheet and a written memo, order counterbalanced.
- Measures
- Decisions against the reference readings, stated confidence against P(pass) (calibration), the assumption named as decisive, and time.
- Pass line
- More correct stop or continue decisions, better calibration, and the decisive assumption named in at least 3 of 4 scenarios.
How it is built
10 · Stack and craft- 1 workspace in vanilla JavaScript with hand-built SVG. No framework, no chart library at runtime, no network calls. It runs from disk as well as from a server.
- 1 seeded generator pre-draws common random numbers for every meeting and calibrates the 5 blocks; a build step checks that the data file regenerates byte for byte, so the chart, the tables, and this page cannot disagree.
- Every meeting keeps its own random draws while a slider moves, so a change in the chart comes from the assumption, not from new noise.
- Break-even values are found by bisection and checked against a brute-force scan.
- Deep links name the view, the standard, the preset, and every assumption. Decisions export as Markdown and JSON.
- Native sliders with value text, a debounced live region for P(pass), a table twin for every chart, labels never under 12px, and no animation. Built to a WCAG 2.1 AA target, not audited.
- Diagram sources: editable Excalidraw files with SVG and PNG exports.